


1. Introduction
A worldwide, unprecedented progress has been boosted towards renewable energy technologies mainly due to dramatic climatic change and endangering condition of fossil fuels. At present, there is a huge thirst on energy and power from portable consumer electronics and hybrid / electric automobiles to industrial power systems. To fulfill the demand, in fact there is a fast growth in renewable energy production from solar and wind [1]. Though they are the most abundant and readily available sources, they inherently exhibit a considerable variability with intermittent spikes and drops. So, efficient, safe and inexpensive energy storage devices are mandatory to make the best of the electricity generated from them [2]. They can promote reliability and effectiveness by storing energy when in excess and releasing when in high demand. Amongst the energy storage devices, super capacitors are lining at the forefront with their distinctive merits such as rapid charge discharge process, long life span, low maintenance and high durability. They are assumed to be bridging the gap between high energy batteries and high power conventional capacitors [3]. Mainly there are two types of super capacitors as electric double layer capacitors (EDLCs) and pseudo capacitors. The former utilize carbon based electrode materials whereas the latter consist with conducting polymer or metal oxide based electrodes. EDLCs store energy through the separation of electrons and ions at the electrolyte electrode interface [4]. In pseudo capacitors, charge storage mechanism is related to redox reactions. They possess many advantageous properties that include fast doping dedoping reactions, high charge density and easy synthesis. An ample amount of research work has been done on pseudo capacitors based on liquid electrolytes [5,6]. Due to the adverse drawbacks, attention has been now focused on solid polymer electrolytes and among them, gel polymer electrolytes (GPEs) have been identified as a very appealing candidate. It is a well accepted fact that a salt/solvent liquid electrolyte is encapsulated inside the polymer network in a GPE. As a result of maintaining satisfactory conductivities as well as mechanical stabilities, GPEs have been extensively employed for numerous applications including batteries, electro chromic devices, super capacitors and artificial muscles [7,8,9].
In this work, polyacrylonitrile (PAN) was used as the polymer and ethylene carbonate (EC), propylene carbonate PC) as the solvents. Sodium thiocyanate (NaSCN) was used as the salt. As per literature review, PAN has not been widely used for super capacitors compared to polymethylmethacrylate (PMMA) [8,10]. And also, in the reported study, the electrodes comprising with polypyrrole (PPy) have been electro polymerized in the presence of sodium perchlorate (NaClO4). Many researchers have fabricated PPy electrodes with lithium based salts to be used for redox capacitors.
2. Experimental Section
2.1 Preparation of GPEs
Polyacrylonitrile (PAN - 99%), ethylene carbonate (EC - 98%), propylene carbonate (PC - 99%) and sodium thiocyanate (NaSCN - 97%) were purchased from Aldrich and used as received. Appropriate amounts of EC and PC were mixed with NaSCN in a closed weighing bottle by magnetically stirring for about 6 hours. After that, required amount of PAN was added in to the mixture and stirring was continued. Then, heating was done at 120°C for 1 hour. The resultant homogenous hot viscous mixture was pressed in between two well cleaned glass plates to obtain a thin free standing GPE film. For the purpose of finding the optimum composition which has a high ionic conductivity and a mechanical stability, several GPE films were prepared by varying PAN and NaSCN concentrations while keeping EC: PC weight ratio fixed at 1:1.
2.2 AC conductivity measurements
A circular shaped sample was cut from the GPE film and it was sandwiched in between two stainless steel (SS) electrodes. The thickness and the diameter of the sample were measured using a micrometer screw gauge. AC Impedance data were gathered by using a Metrohm Autolab M101 impedance analyzer in the frequency range 0.4 MHz - 0.01 Hz from room temperature to 55°C. Ionic conductivity was calculated using the equation, σ = (1/Rb)(t/A) where t is the thickness of the film, Rb is bulk electrolyte resistance obtained from impedance plot and A is the area of the GPE film. This procedure was repeated for each sample prepared varying salt concentration as well as polymer concentration.
2.3 DC polarization measurements
A circular shape GPE sample was cut from the GPE film that has the optimum conductivity. It was then sandwiched in between two well cleaned stainless steel electrodes and the assembly was housed in side a spring loaded sample holder which is sealed by means of an O ring. By applying a DC bias potential of 1 V, the current variation with time was monitored. The ionic transference number (tion) was calculated using the equation, tion = (ttotal − ts) / ttotal . Here, ttotal is the initial current and ts is the steady state current.
2.4 Preparation and characterization of conducting polymer electrodes
Pyrrole which has been purchased from Aldrich was distilled and stored in the dark in a refrigerator prior to use. Electrochemical polymerization was done in the presence of sodium perchlorate (NaClO4) (Aldrich, 98%) in a non-aqueous medium on fluorine doped tin oxide (FTO) glass plates using a computer controlled potentiostat (Autolab M101). The three electrode electrochemical cell used for electrochemical polymerization consisted of a working electrode (FTO), a Ag/Agcl reference electrode and a Pt counter electrode. PPy films of the thickness of 2 × 10⁻⁶ m were made by applying a current density of 1 mA cm−2 for a period of 480 s. Surface morphology of polypyrrole (PPy) electrodes was examined using Scanning Electron Microscopy (SEM). Mass of the electrode was measured for the calculation of specific capacitance.
2.5 Fabrication and electrochemical characterization of pseudo capacitors
A GPE film was sandwiched in between two PPy electrodes of area 1 cm2 . Pseudo capacitors were tested using Cyclic Voltammetry (CV), Electrochemical Impedance Spectroscopy (EIS) and Galvonostatic Charge Discharge (GCD) test.
CV tests were carried out varying the potential window at the scan rate of 0.01 V s−1. Cycling was done with a three electrode setup using a Metrohm Autolab M101 potentiostat at room temperature.
Specific capacitance was calculated using the following equation CSC = (∫IdV ) / Δv.S where ∫IdV is the integrated area of the cyclic voltammogram, Δv is the potential window and S is the scan rate [11].
Impedance measurements were gathered using a Metrohm Autolab M101 impedance analyzer over the frequency range 0.4 MHz - 0.01 Hz. Specific capacitance (CSC) of the pseudo capacitor was calculated using the Nyquist plot and the Bode plot. When using the Nyquist plot, CSC was calculated using the equation, CSC = (1/2πfZ”). Here, f is the frequency and Z is the imaginary part of the impedance at frequency, f. Using the bode plot of the real part of capacitance (C’) vs frequency, CSC was found at the maximum C’. Relaxation time (t) can be determined using the bode plot drawn between the imaginary part of capacitance (C”) vs frequency. Then, τ = 1/2πf0 where f0 corresponds to the frequency at the maximum C”.
For GCD test, the potential response vs time was recorded at a constant current of 300 μA for 1000 cycles. Charging and discharging were discontinued at the potential limits 0.5 V and 0.08 V respectively. Using the equation CdC = I / (dv/dt), the discharge capacitance (CdC ) was calculated [11]. Here, I is the constant discharge current, dt is the discharge time and dV is the potential drop upon discharging excluding IR drop.
As the pseudo capacitor consists with two identical capacitors in series corresponding to each electrode, the single electrode specific capacitance was calculated by multiplying the specific capacitance (CSC) by 2 and dividing by a single electrode mass, m [11].
3. Results and Discussion
3.1 Optimization of the GPE composition
Samples having different salt concentrations were prepared and their compositions and film thicknesses are shown in Table 1.
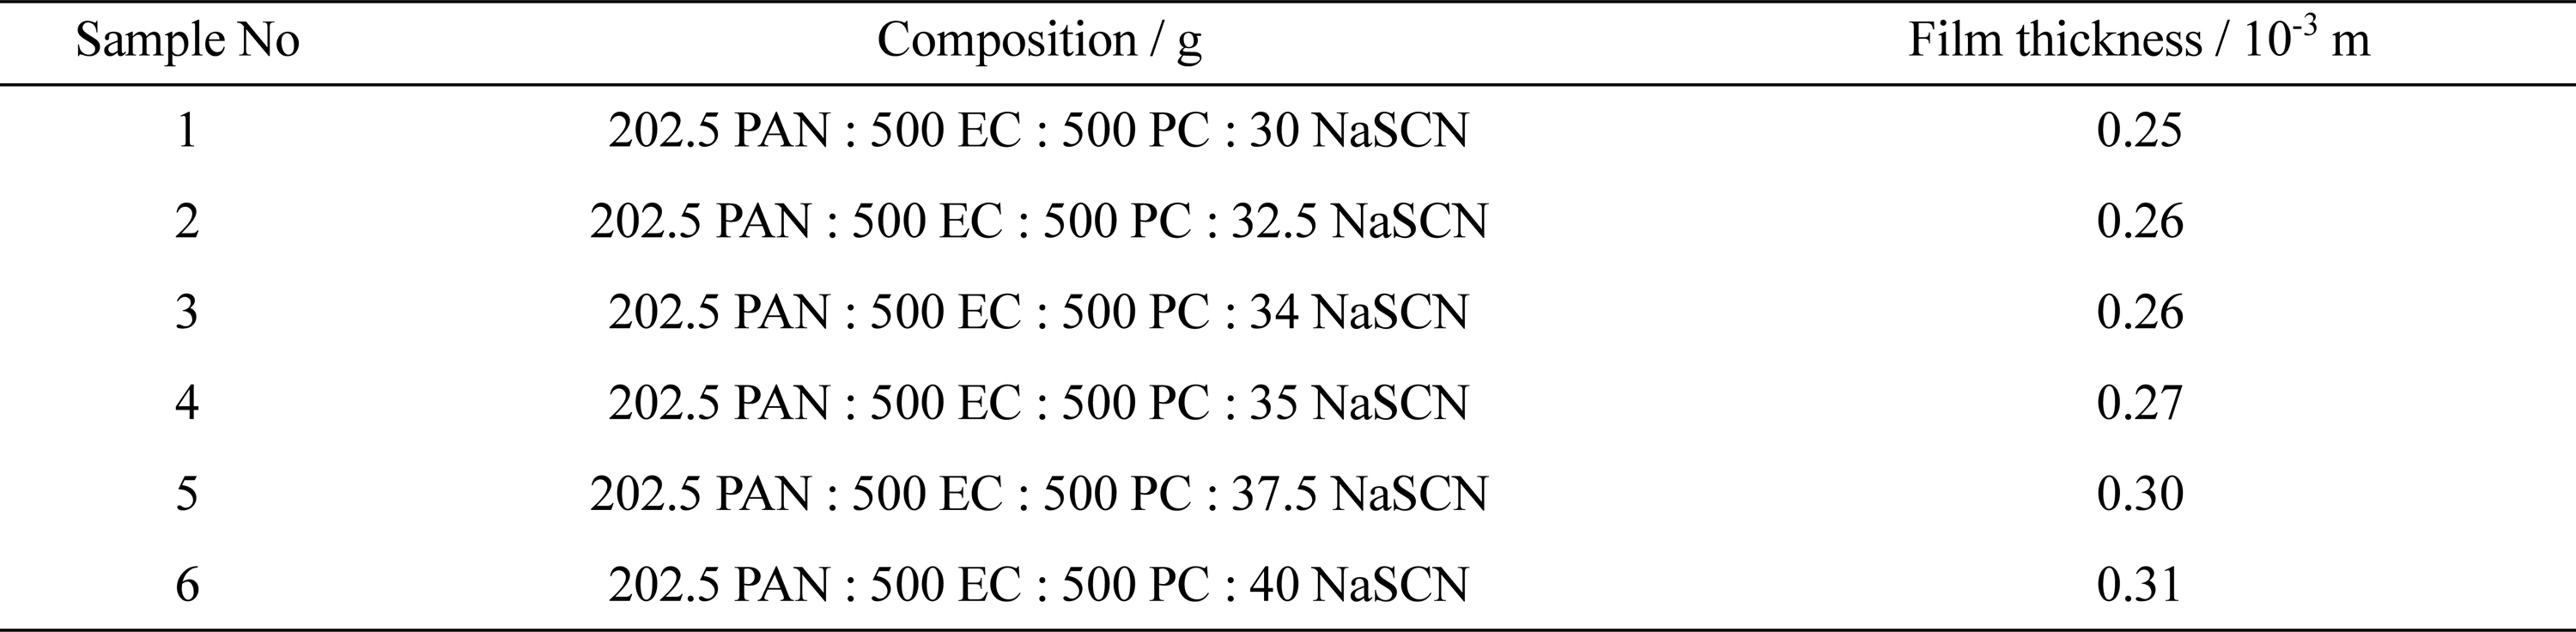
Fig. 1 illustrates the variation of conductivity with temperature for different salt concentrations.
Fig. 1.
Variation of conductivity of GPE with temperature for different salt concentrations (by weight basis)
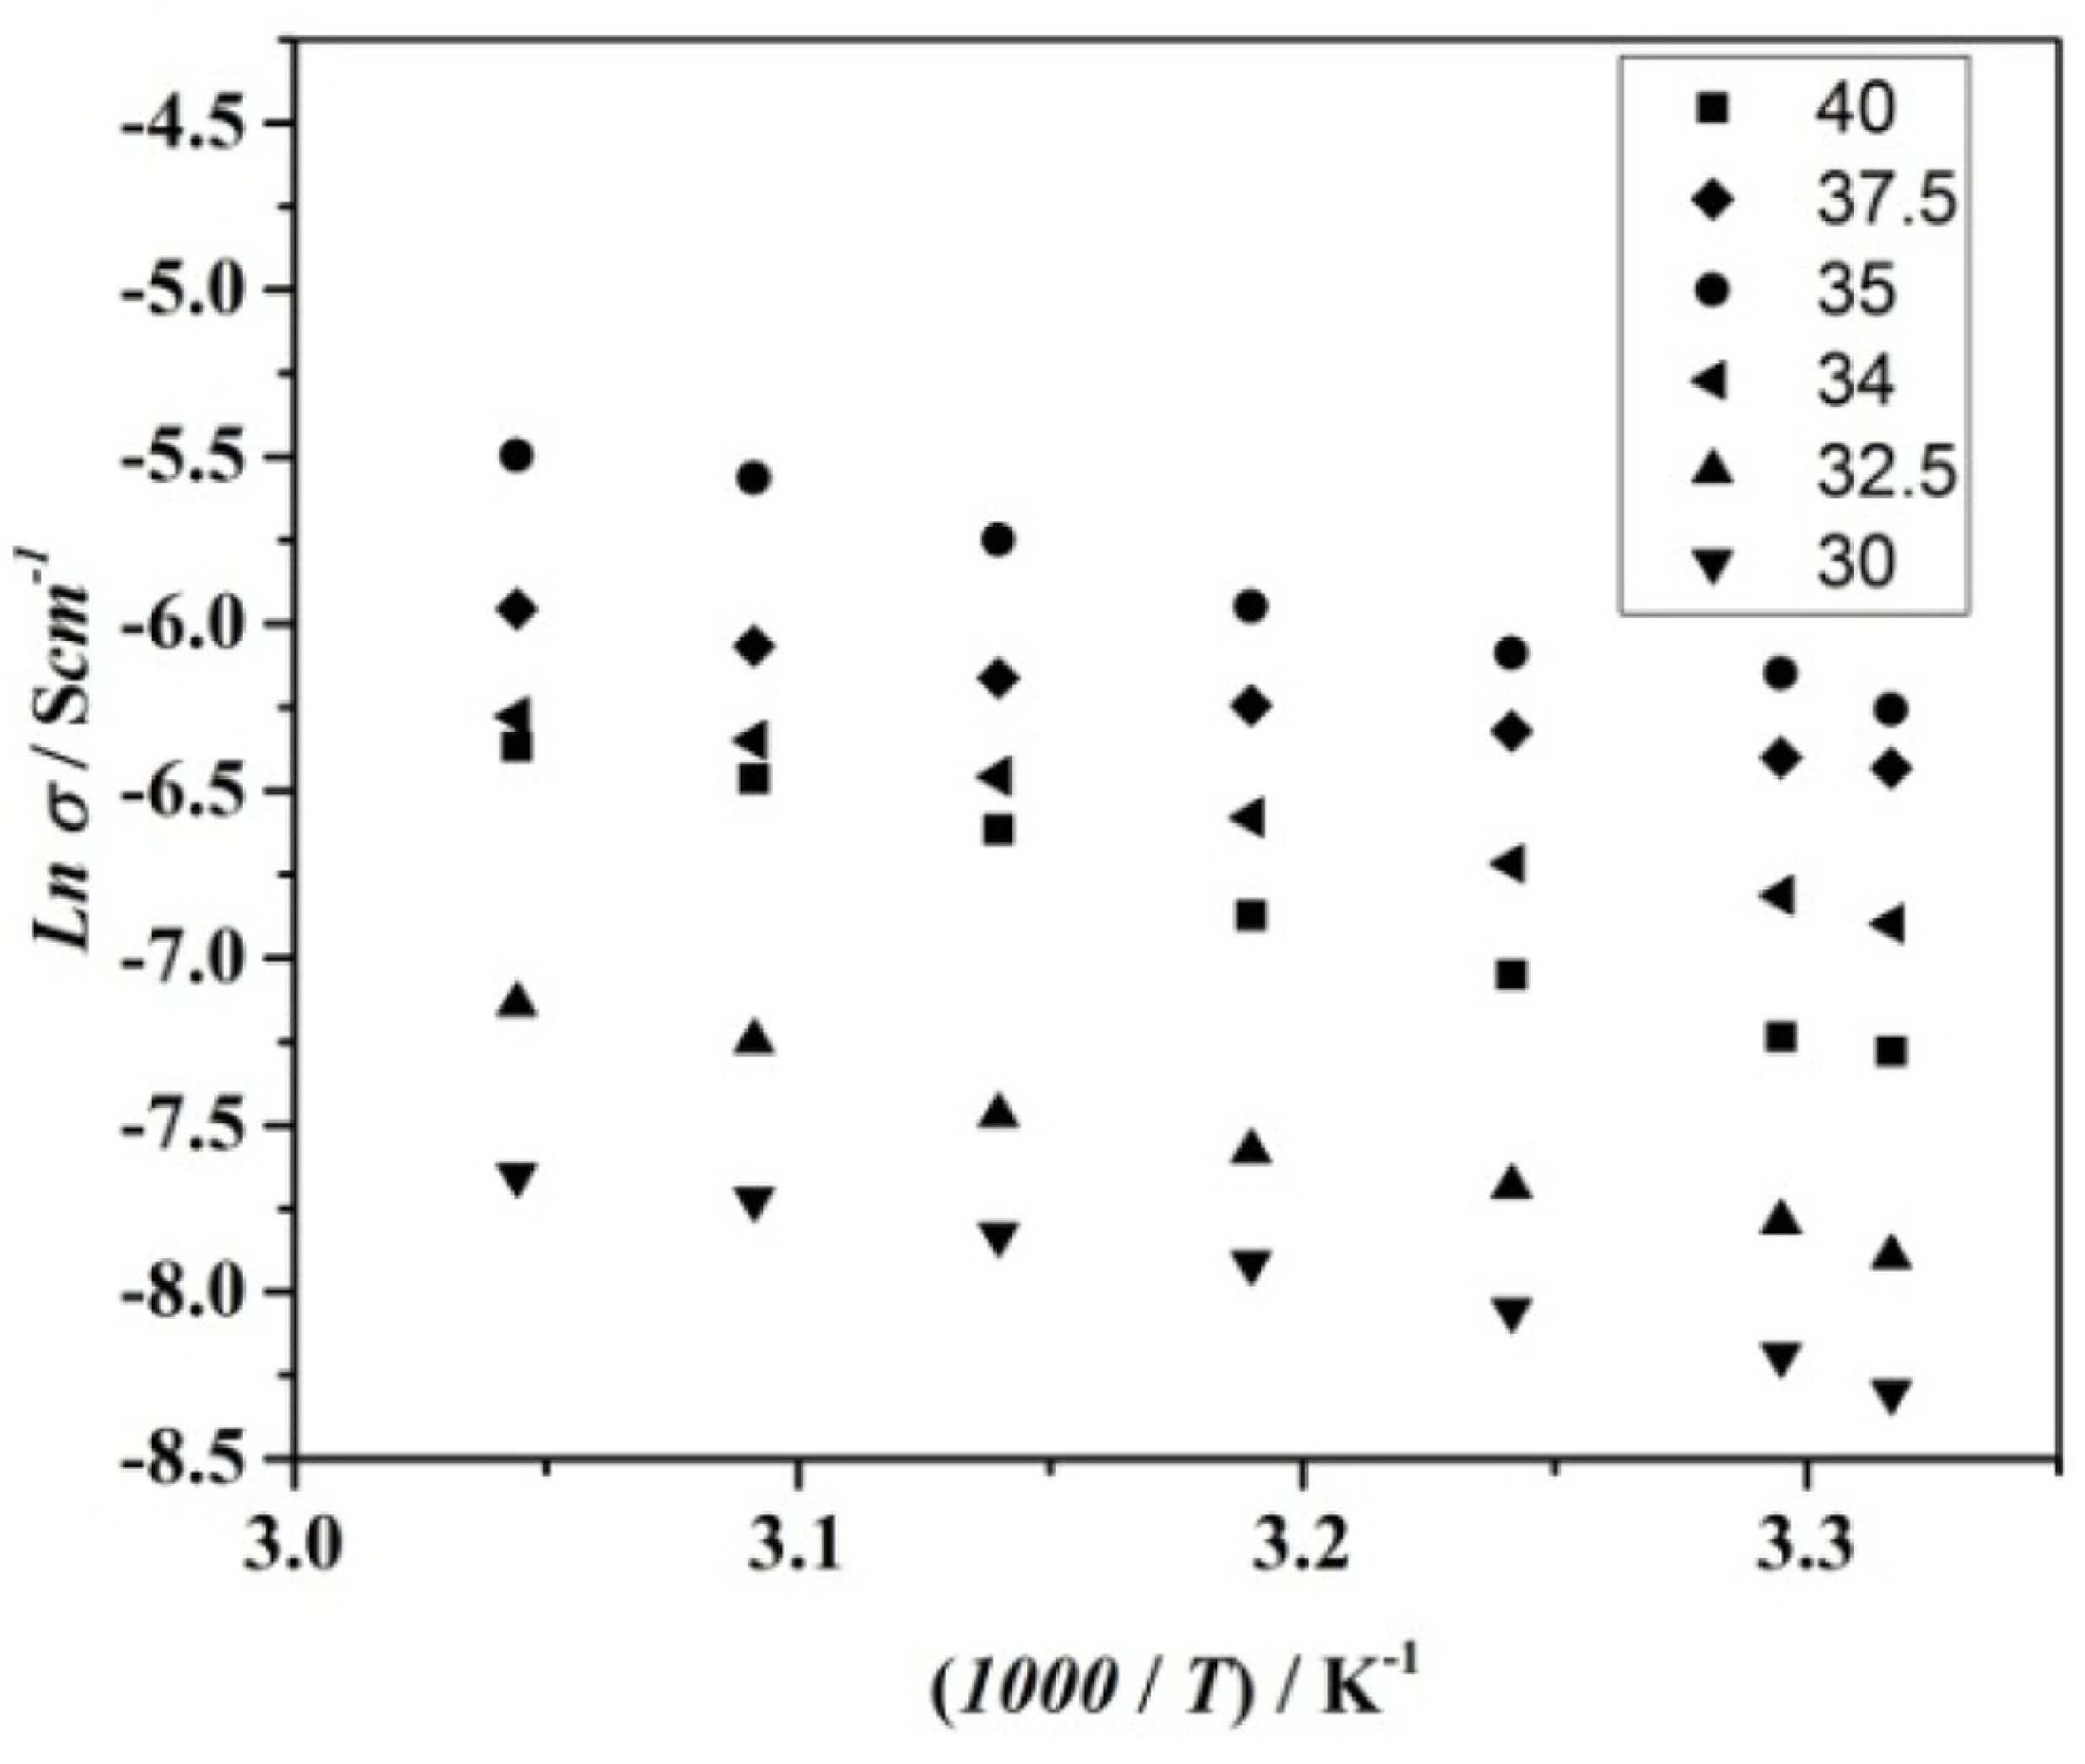
It was noticed that when the salt concentration was increased, conductivity increased initially but then it decreased upon further increment of salt concentration. It is well known that there are different factors that affect the conductivity such as density of the charge carriers and mobility of the charge carriers. The increasing and decreasing trends of the conductivity appear as a result of competition among those factors in governing the conductivity. Upon increasing salt concentration, charge carrier density increases resulting conductivity increment. At high salt concentration, there is a possibility for formation of ion aggregates. They do not support for conduction and hence, conductivity reduces [12]. Also, at high salt concentrations, viscosity of the medium increases hindering ionic mobility. As a result, conductivity decreases.
Samples having different salt concentrations were prepared and their compositions and film thicknesses are shown in Table 2.
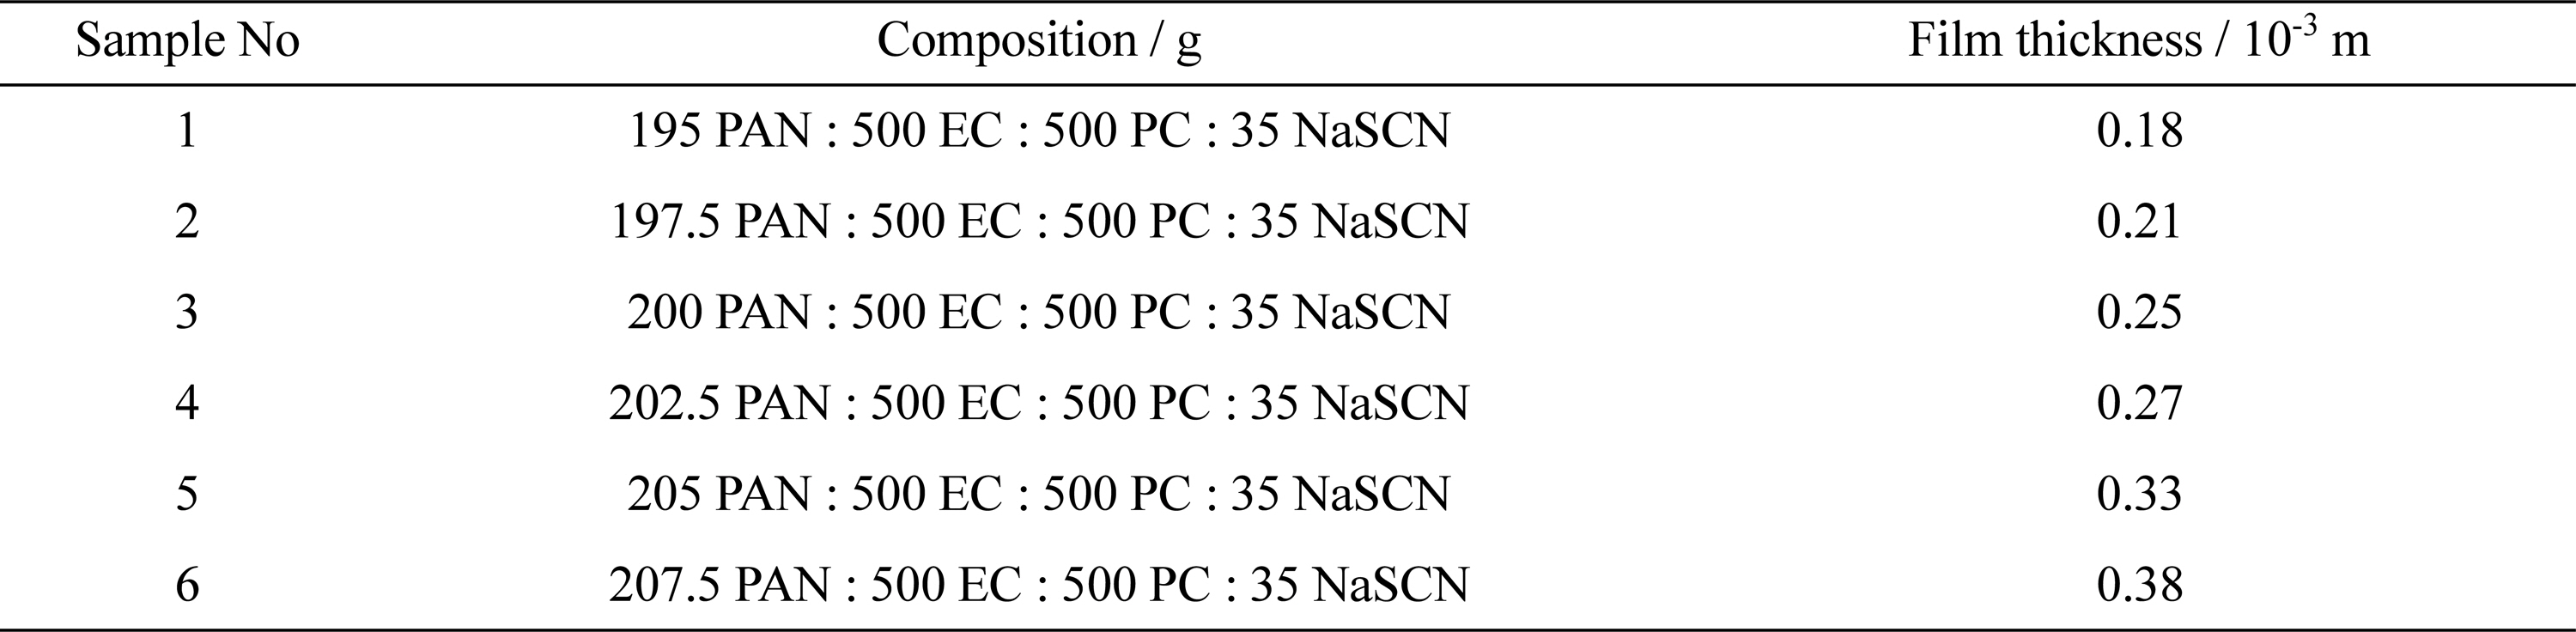
Fig. 2 shows the variation of conductivity with temperature for different PAN concentrations.
Fig. 2.
Variation of conductivity of GPE with temperature for different polymer concentrations. (by weight basis)
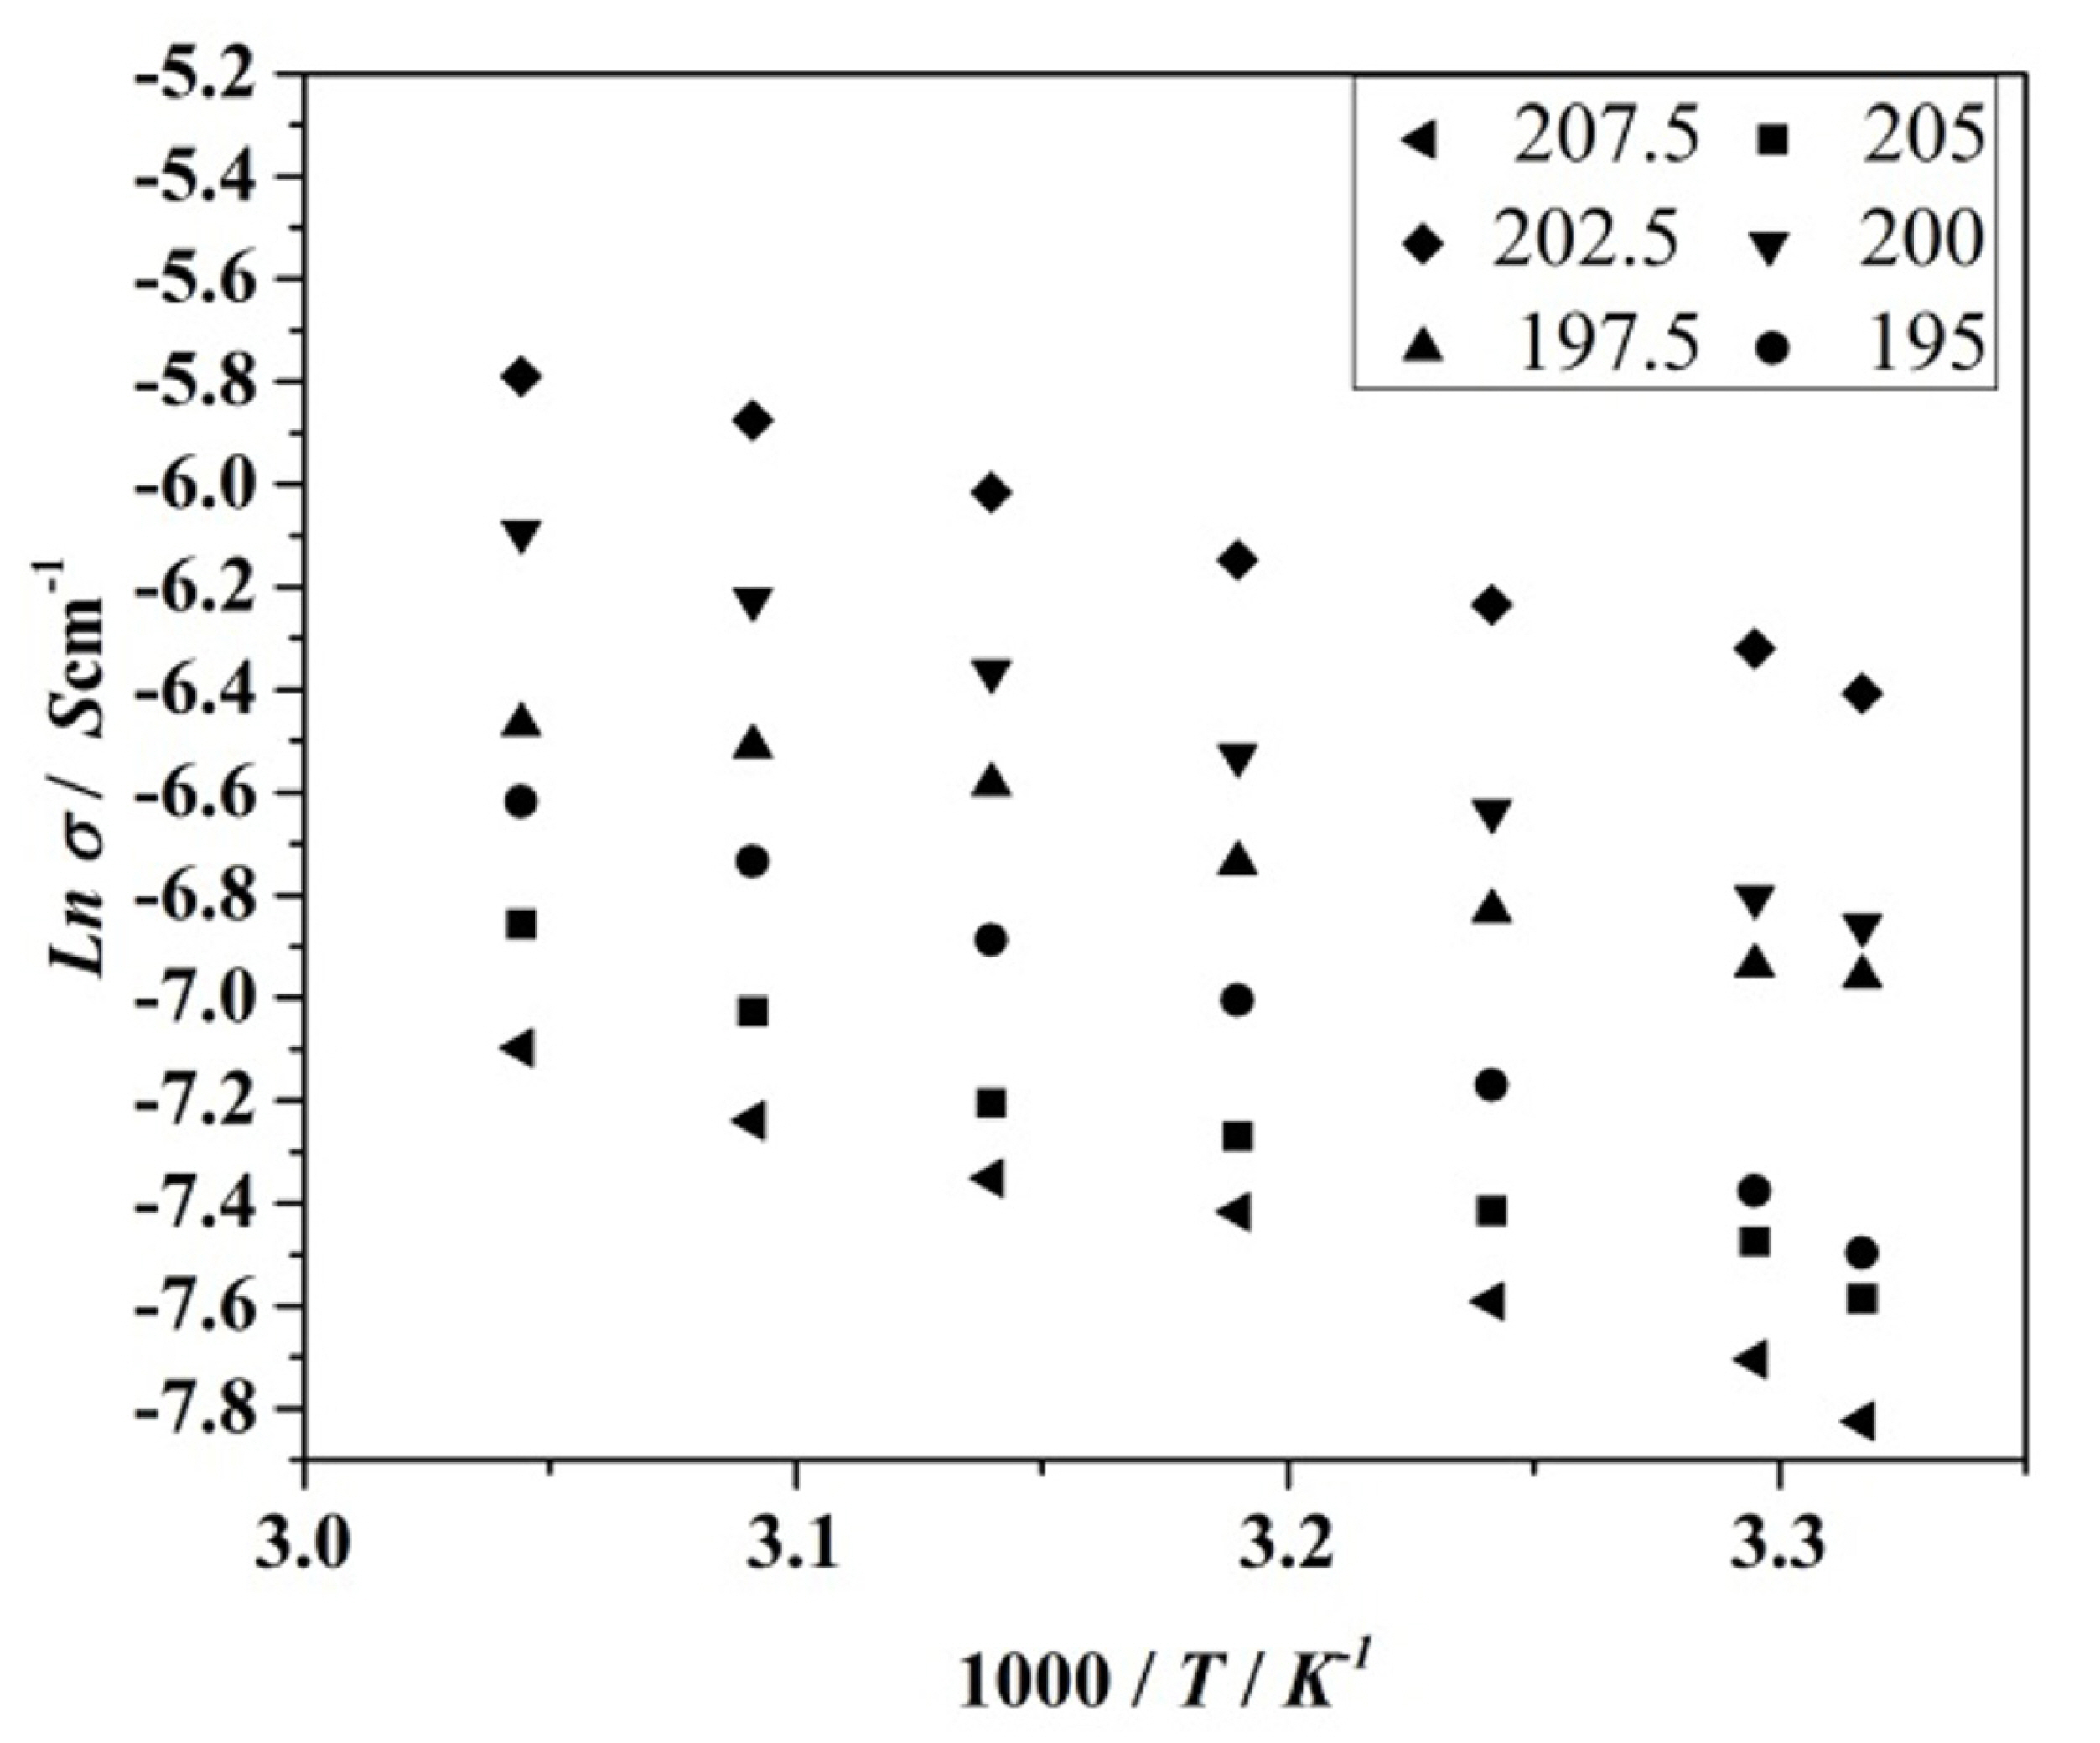
Initial increment of conductivity with increasing PAN concentration may be due to the ‘breathing chain model’ explained by S. Chandra et al. [13]. As per that model, polymer chains breathe while they open and close occupying different volumes. It results localized pressure fluctuations in the surrounding area. This pressure is assumed to lead dissociation of ion pairs and hence conductivity of the liquid electrolyte which is encapsulated within the polymer network may increase. After a certain polymer concentration, conductivity may be affected negatively due to blocking of conduction paths by polymer network.
In both instances, it is clearly seen that upon increasing temperature, conductivity increases irrespective of salt or polymer concentration. This happens when charge carriers gain more energy due to temperature increment and becoming more mobile. In addition, the variation of conductivity (σ) with temperature follows Arrhenius behavior given by σ = Aexp(−Ea/kBT). Here, A is a constant, Ea is the activation energy, kB is the Boltzmann constant and T is the temperature. This elucidates the fact that conductivity mechanism takes place via jumping of ions in the medium along the polymer network.
The composition, 202.5 PAN : 500 EC : 500 PC : 35 NaSCN (by weight) showed the highest room temperature conductivity of 1.92 × 10⁻³ Scm−1. This value is quite suitable for employing the GPE as an electrolyte in devices [14,15].
In addition, this composition resulted mechanically stable thin films of good flexibility which is essential to form ideal interfacial contacts suitable for maximum accessibility of the active electrode materials as well as to allow the opportunity to go for various design variations.
3.2 DC polarization test
Fig. 3 shows the DC polarization curve obtained with stainless steel (SS) electrodes which are acting as blocking electrodes for the GPE.
Fig. 3.
DC polarization curve of the cell having the configuration SS / GPE / SS under a 1 V DC bias potential.
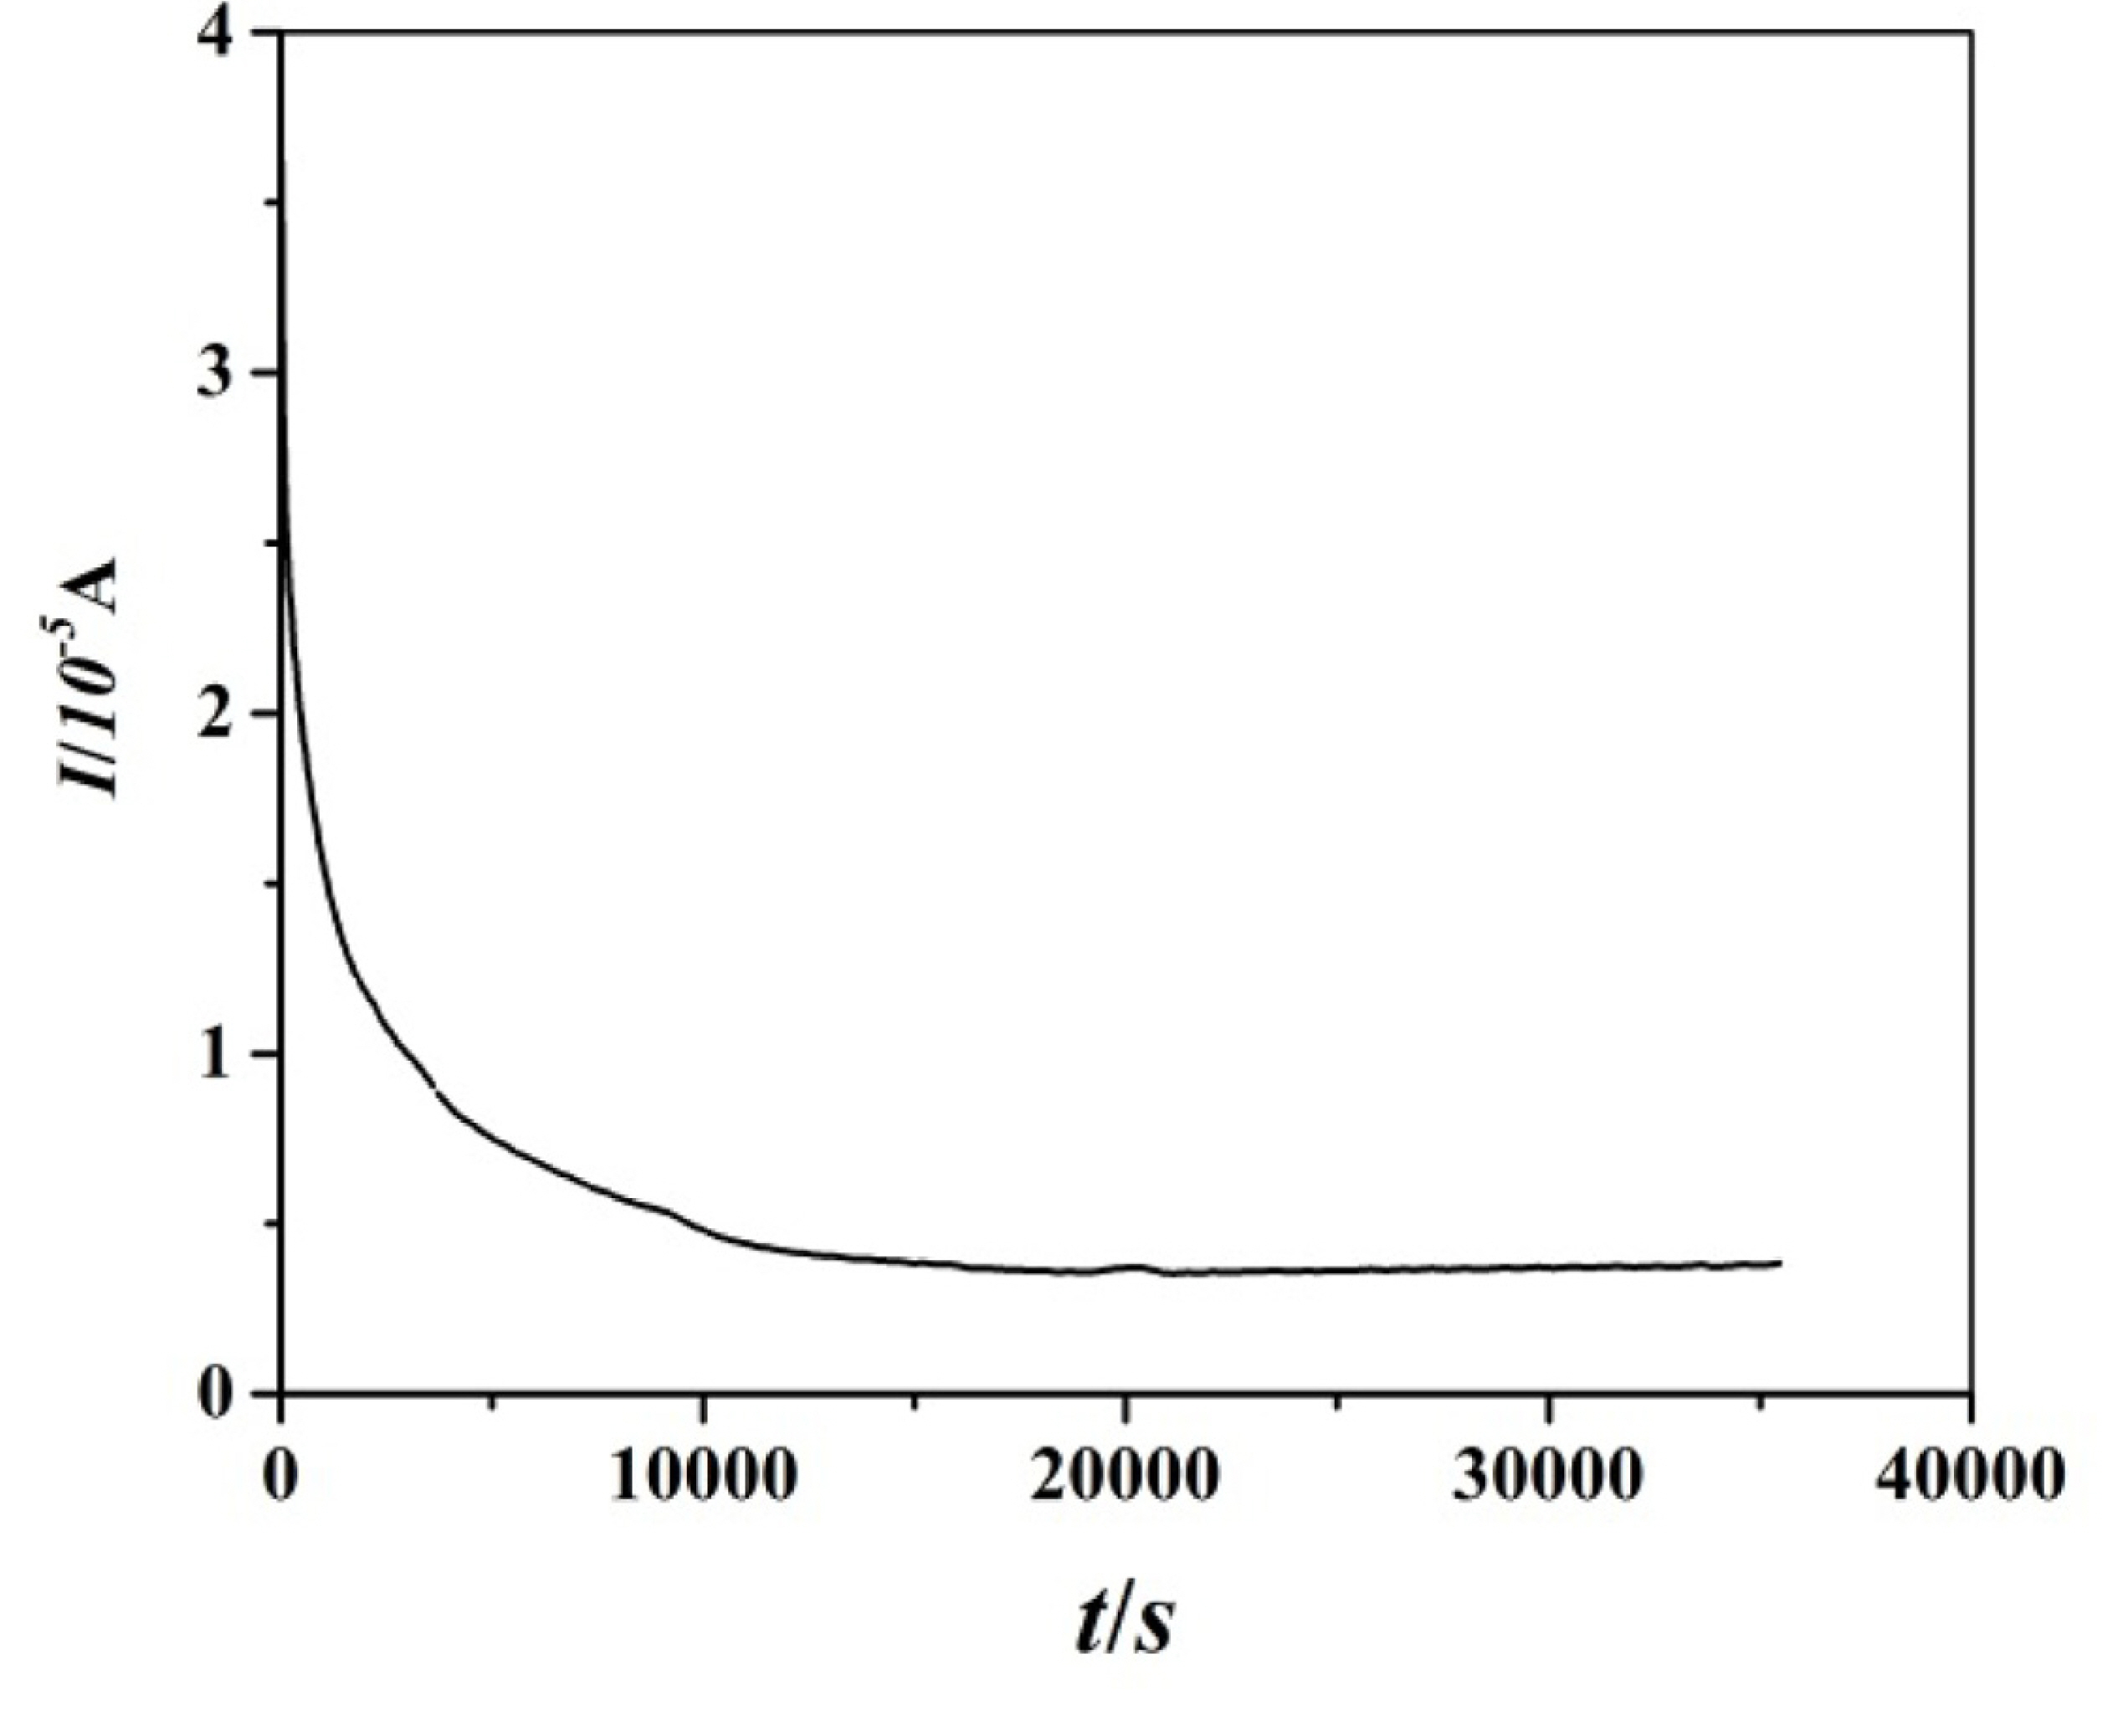
A fast and sudden decrement of current was observed initially. It was then followed by a stable continuous current. The initial drop of current is a result of polarization of ions which are blocked by the electrodes. The electrons for which the electrodes are not blocking give rise to the stable current. If the sample is an ionic conductor, tion value should be equal or close to one. If it is an electronics conductor, tion is very small. If the sample is a mixed conductor, tion lies in between approximately 0.4-0.6. The calculated tion is 0.92. This is close to one. That means ionic contribution is dominant in the system and hence the GPE is a good ionic conductor [16]. This highlights the potential candidacy of the GPE to be employed as an electrolyte.
3.3 Study the morphology of PPy electrodes
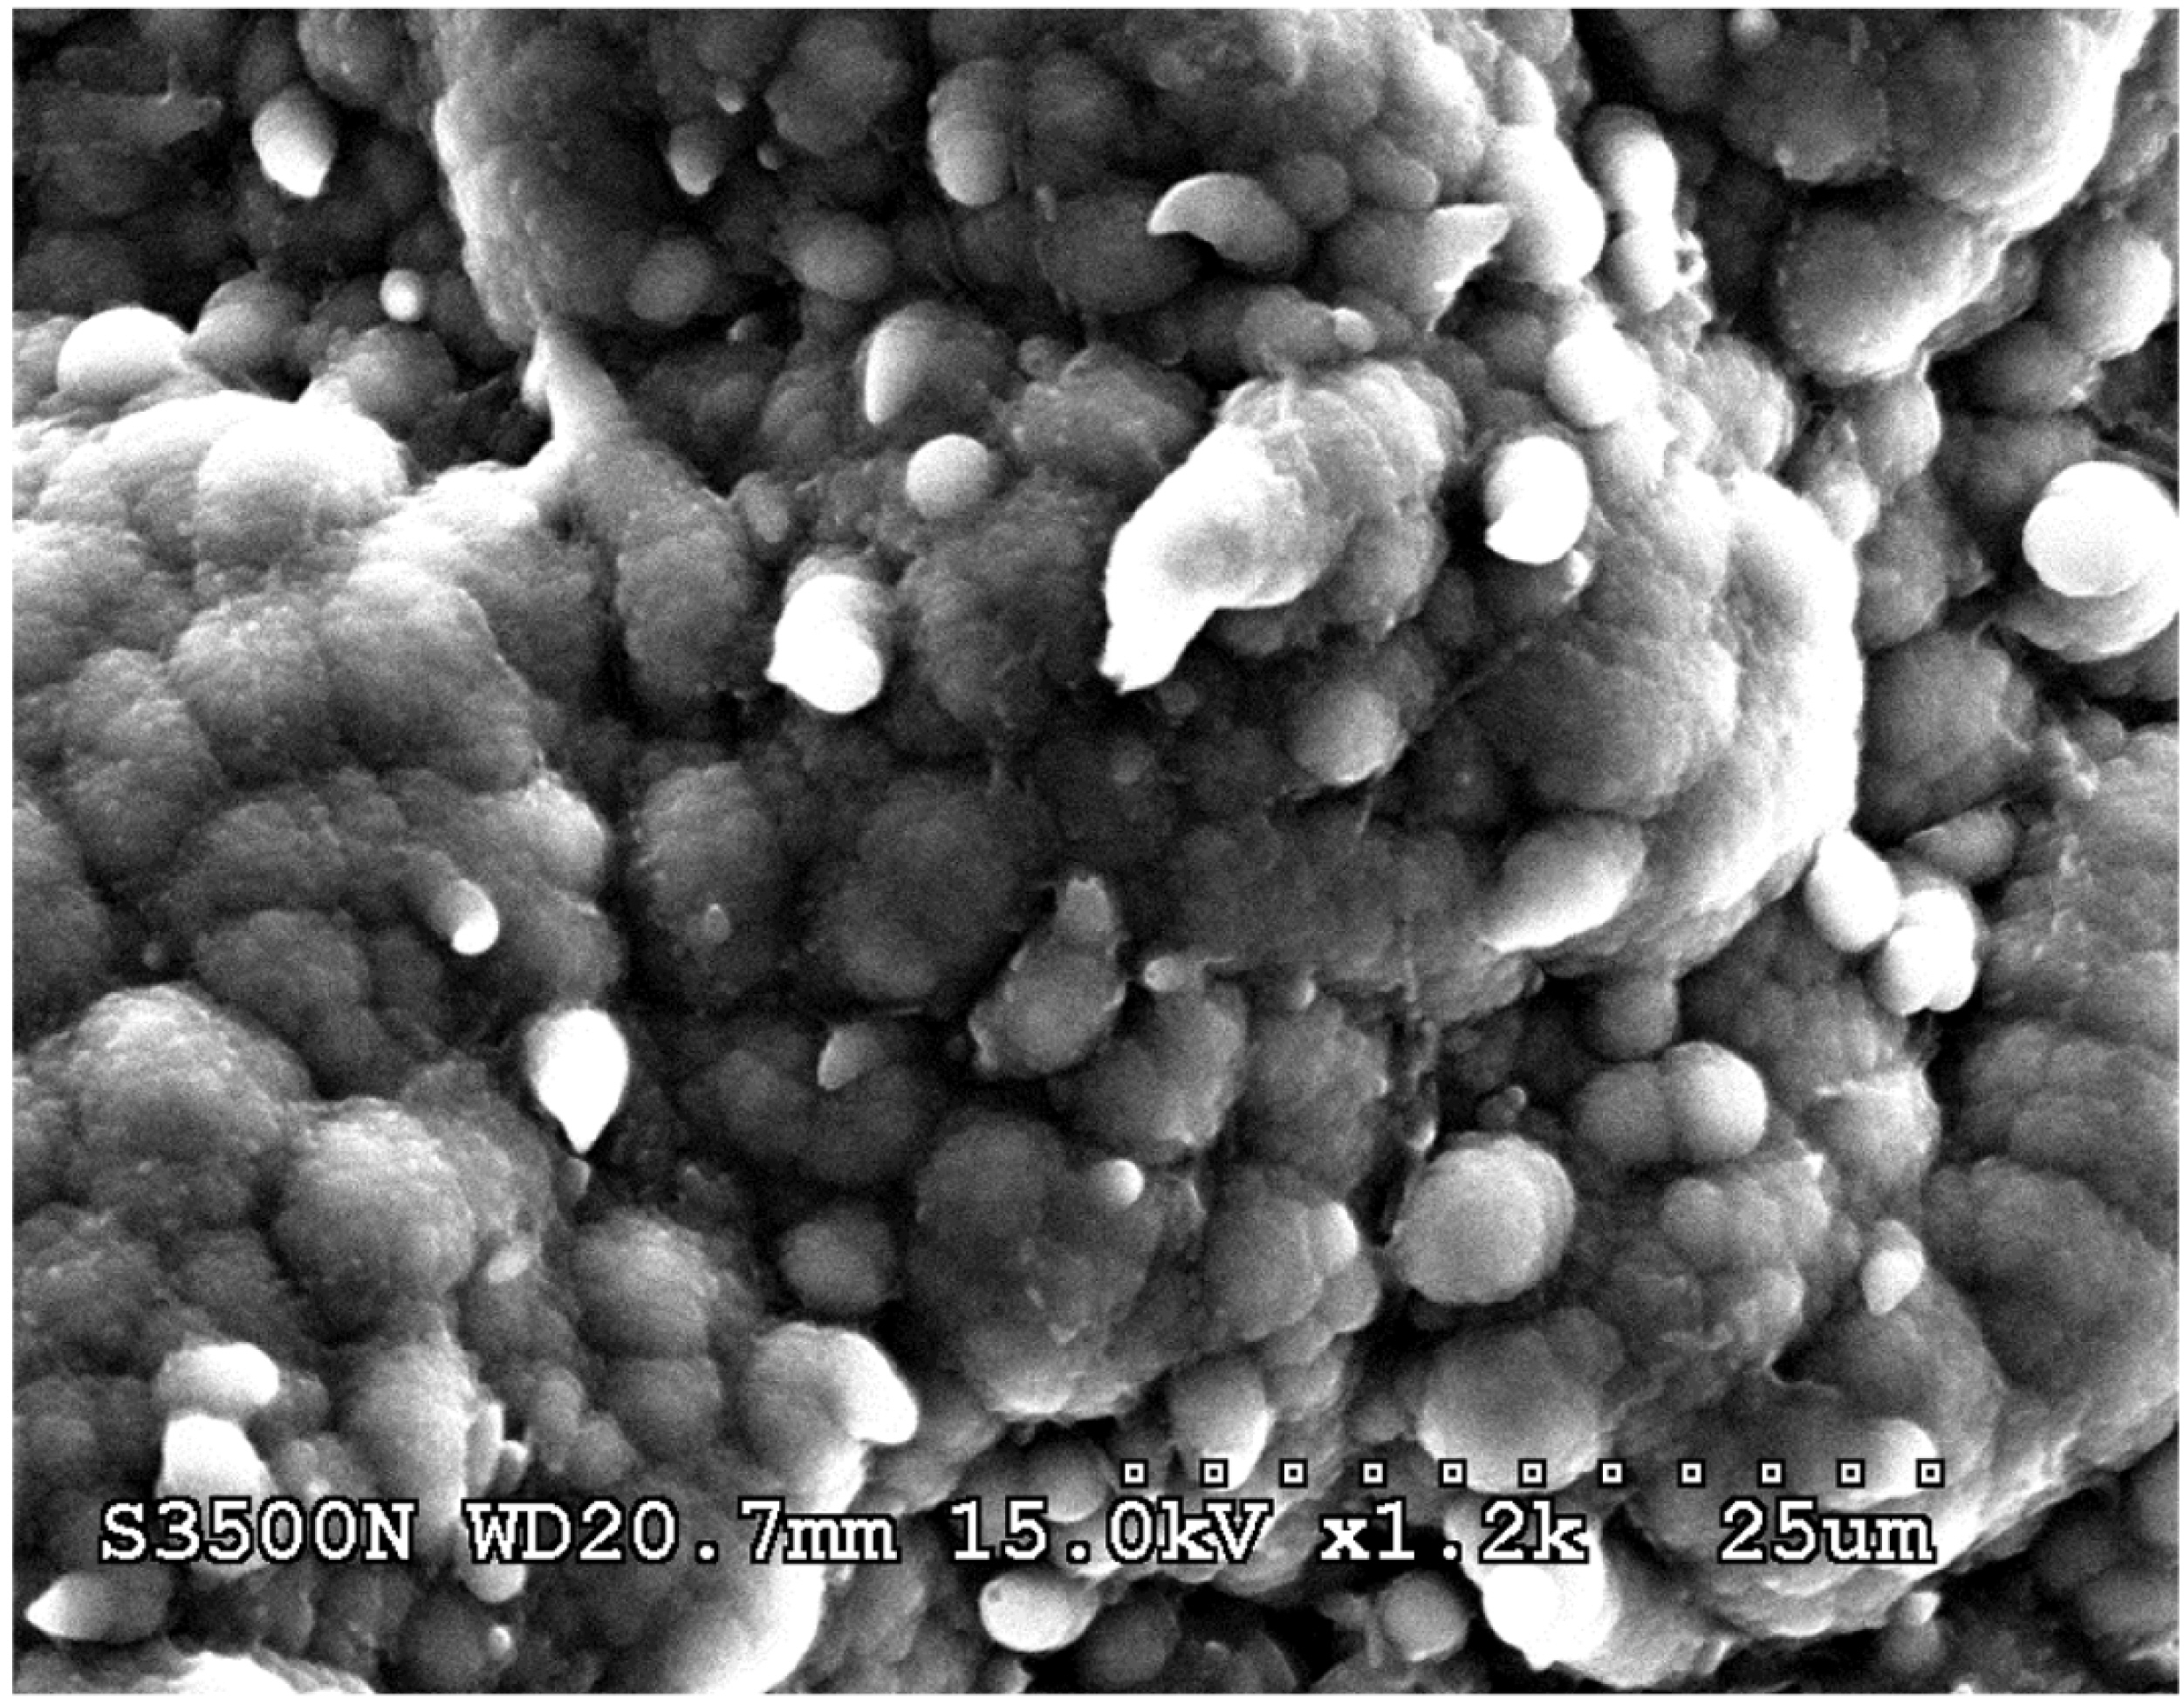
Fig. 4 shows the SEM of PPy : ClO4 film.
It is very clear that surface is not dense. It consists with large globules. Patois et al have reported that with small dopant anions, surface consists with large globules [17]. If the growth of PPy is dense, it reduces the specific capacity drastically because dopants have a limited access to the interior sites of the polymer backbone [18]. The porous nature as evidenced in Fig. 4 promotes charge storage. With the resulting SEM, therefore, it can be inferred that PPy : ClO4 is having a suitable surface morphology to be acted as an electrode for capacitors.
3.4 Cyclic Voltammetry tests
Cyclic voltammograms (CVs) obtained for the pseudo capacitors within different potential windows at the scan rate of 0.01 V s−1 is presented in Fig. 5.
Fig. 5.
Cyclic Voltammograms obtained for the pseudo capacitors within different potential windows : Scan rate - 0.01 V s−1

CVs take the shape of parallelogram within narrow potential windows. With increasing the potential limits, shape changes and peaks tend to appear. Pseudo capacitors rely on fast and reversible faradaic redox reactions associated with doping and dedoping ions to store charge [19].
These doping and dedoping of ions take place at certain potentials and they are visualized as peaks in the CVs. The absence of such peaks hints the fact that expected redox reactions are not taking place at the lower potential limits [20]. On the other hand, at higher potential limits, there is a tendency for the occurrence of unwanted reactions such as decomposing of materials resulting sudden current increment in CVs. The potential window ranging from −1.0 V to 1.0 V had sharp peaks and the proper shape of a CV related to a redox capacitor. Hence, that potential window was chosen as the optimum potential window. Mass of an electrode was 0.4 mg. The average value of single electrode specific capacitance, CSC was found to be 209.86 F g−1. This is quite higher than the value reported by Palaniappan et al for a polyaniline based redox capacitor with sulfuric acid as the electrolyte and at the same scan rate [5].
3.5 Electrochemical Impedance analysis of pseudo capacitors
Fig. 6 shows a resultant Nyquist plot of a pseudo capacitor. This analysis is very useful in identifying various parameters in relation to properties of bulk electrolyte and electrolyte-electrode interface.
In general, the impedance plot consists with (i) a slightly depressed semicircle at high frequency region (ii) another semicircle at medium frequency region (iii) a linear curve with a phase angle of 45°together with a steep rising curve at low frequency region [20]. High frequency semi circle is corresponding for the electrolyte in the capacitor whereas the other semi circle represents charge transfer resistance between the electrolyte and the electrodes. Low frequency features are due to diffusion controlled processes and capacitive behavior [5].
In the resulting impedance plot in Fig. 6, the high frequency semi-circle was not present. It may be due to the unavailability of required high frequency region. The linear curve at mid frequency region represents the porous electrode. The spike which is having about 45° inclination is due to Warburg diffusion. The steep rising response of impedance measurements in the very low frequency region is an indicator for the capacitive behavior of PPy electrodes. The resulting line is not perfectly parallel to Z” as for a typical capacitive behavior. It may be due to the surface roughness as well as non-uniform active layer thickness [21].
Fig. 6.
Resulting Nyquist plot of a pseudo capacitor, PPy : ClO4 / PAN : EC : PC : NaSCN / PPy : ClO4 in the frequency range 0.4 MHz - 0.01 Hz at room temperature.
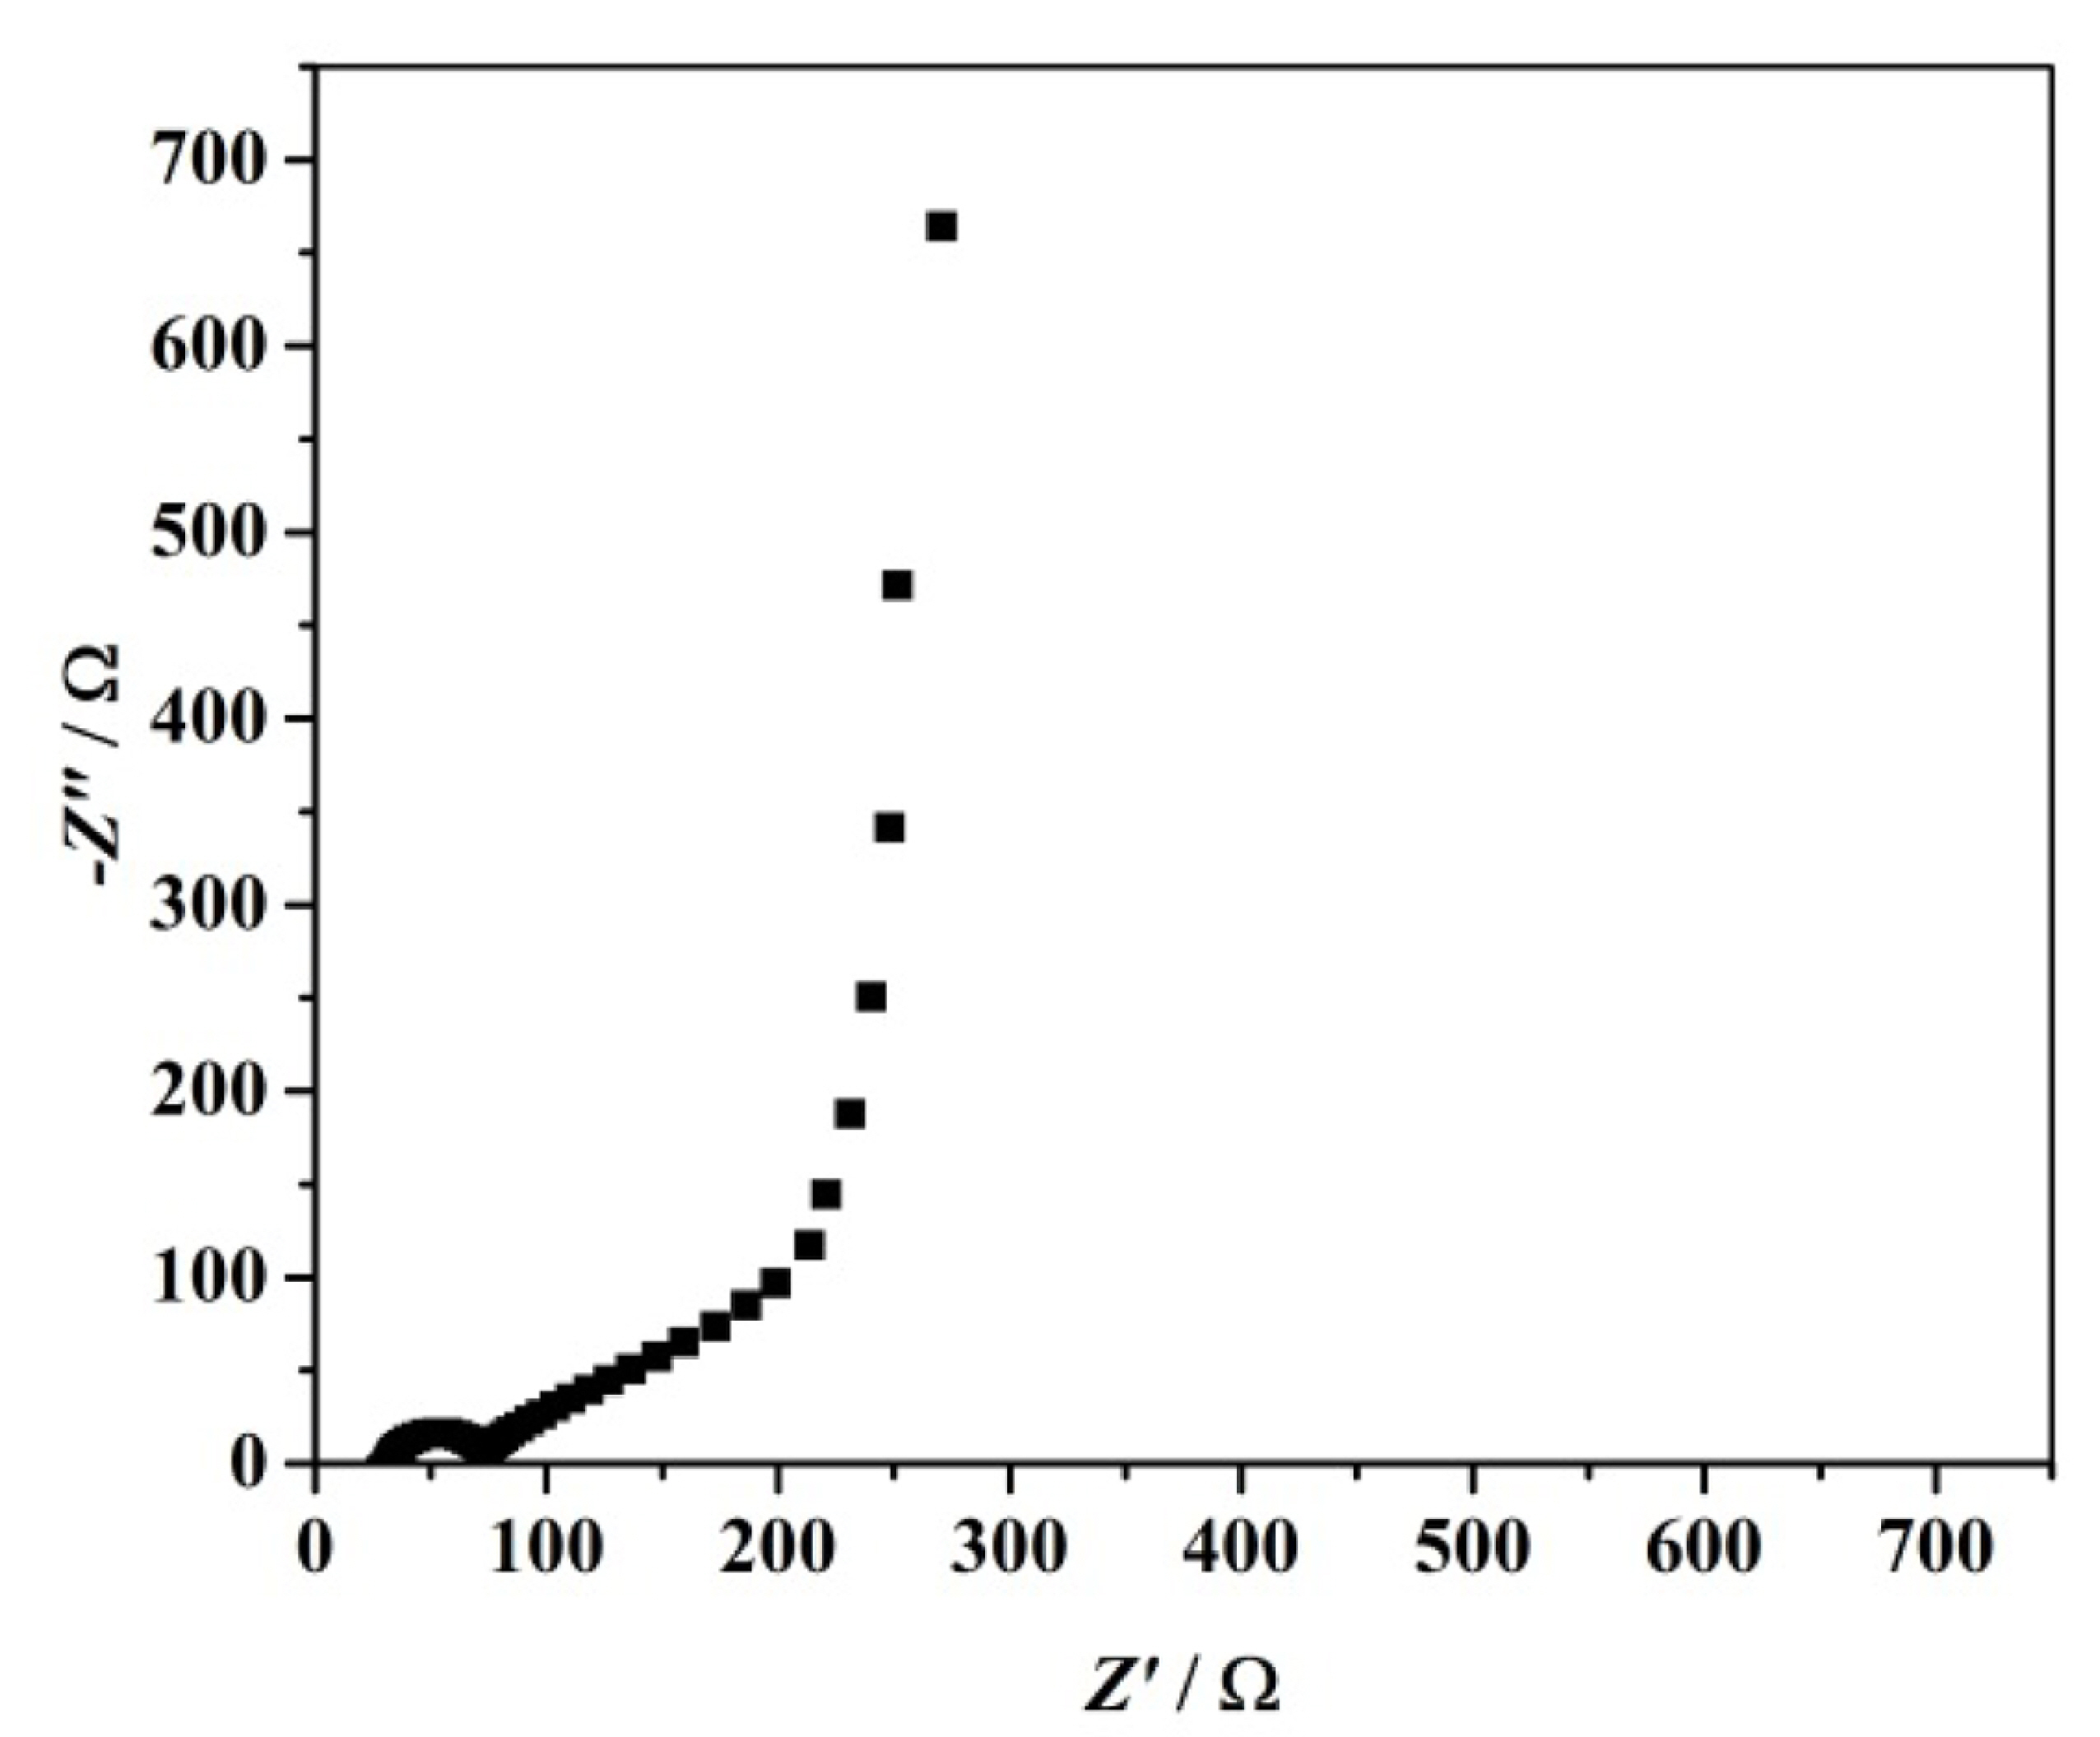
The value of single electrode CSC calculated at 0.01 Hz was about 84 F/g. This is comparable with the value reported by Gupta et al for a redox capacitor based on PMMA GPE and PPy : ClO4 electrodes [10].
It should be noted that specific capacitance value may be changed upon the frequency value selected. It is due to several reasons such as diffusion/migration of ions due to concentration gradients in the electrolyte, charging of deep pores present in the electrodes and due to thermal/stochastic effect.
The absence of any foul features other than the semicircle and the spikes is an indication for the non-existence of unwanted interfacial effects between electrolyte and electrode.
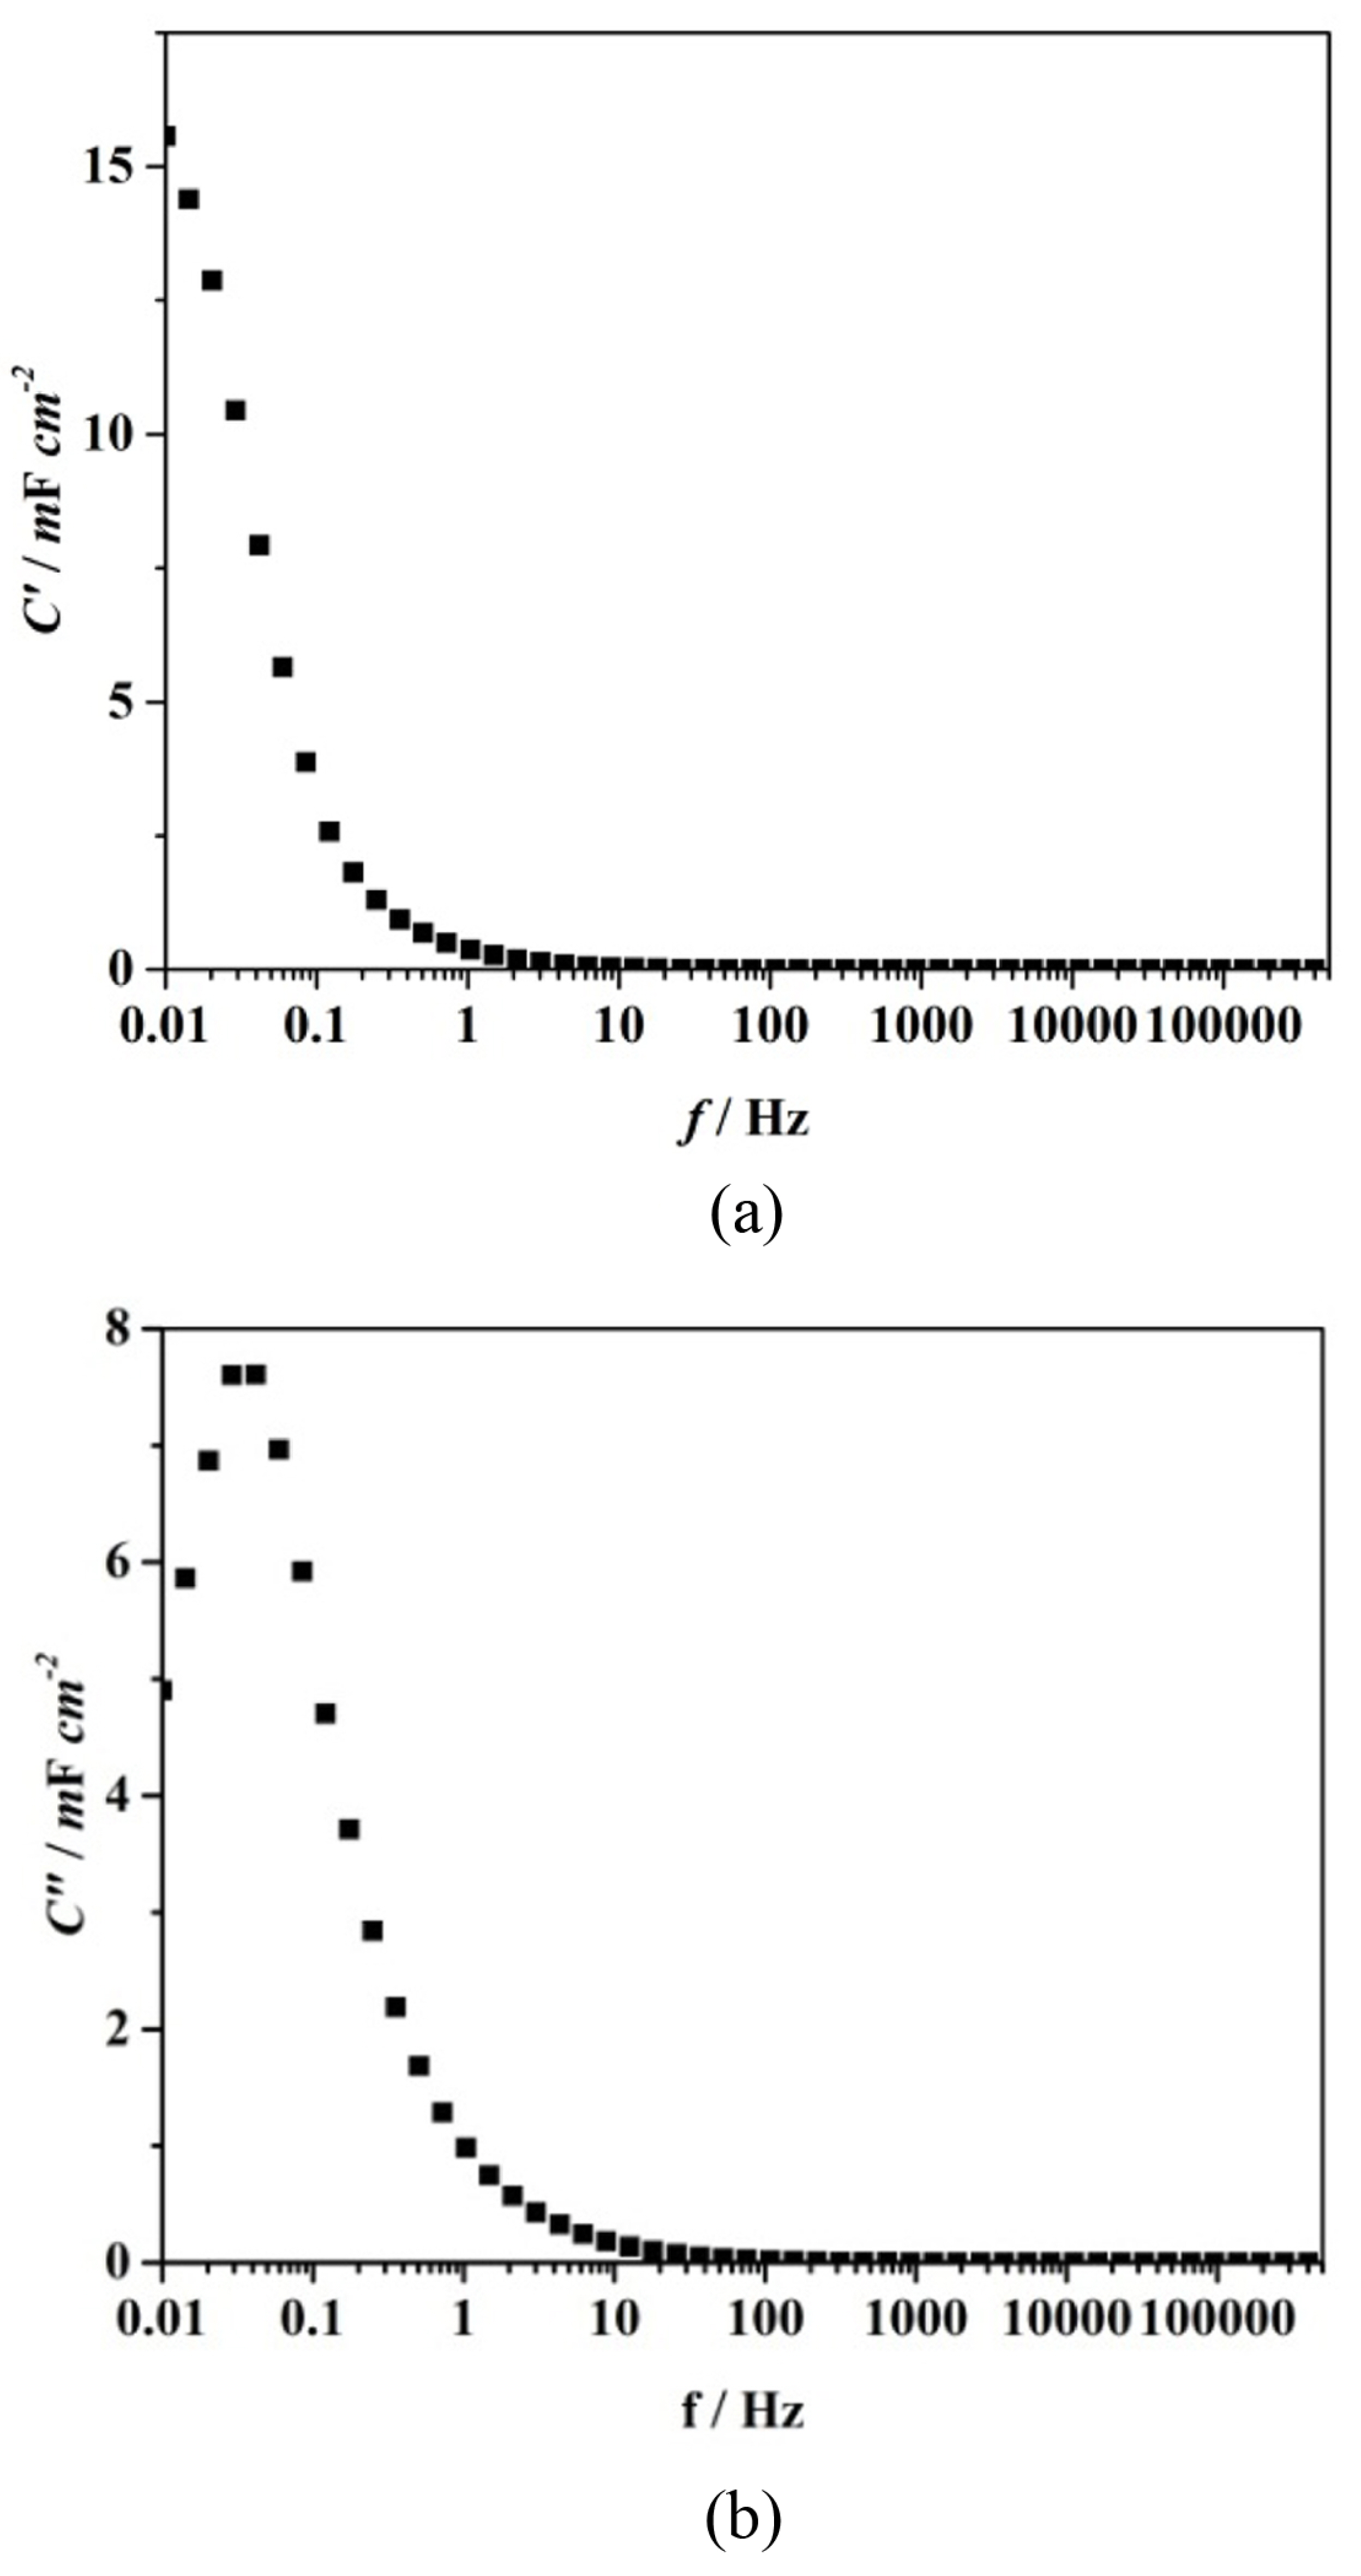
Fig. 7(a) and (b) are the resulting bode plots drawn between the real part of the capacitance vs frequency and imaginary part of the capacitance with frequency. The single electrode CSC value was found to be 16 mF/cm−2 which is equivalent to 78 F/g. Nyquist plot and Bode plots give near equal values though different from the value obtained by CV technique. The calculated relaxation time, t was 4.68 s. This value suggests that rate of redox reactions are taking place quickly. It is a well-known fact that when the value of t is lower, the ion transfer is takes place very fast [22].
3.6. Galvanostatic Charge Discharge (GCD) analysis
Results of GCD test are given in Fig. 8.
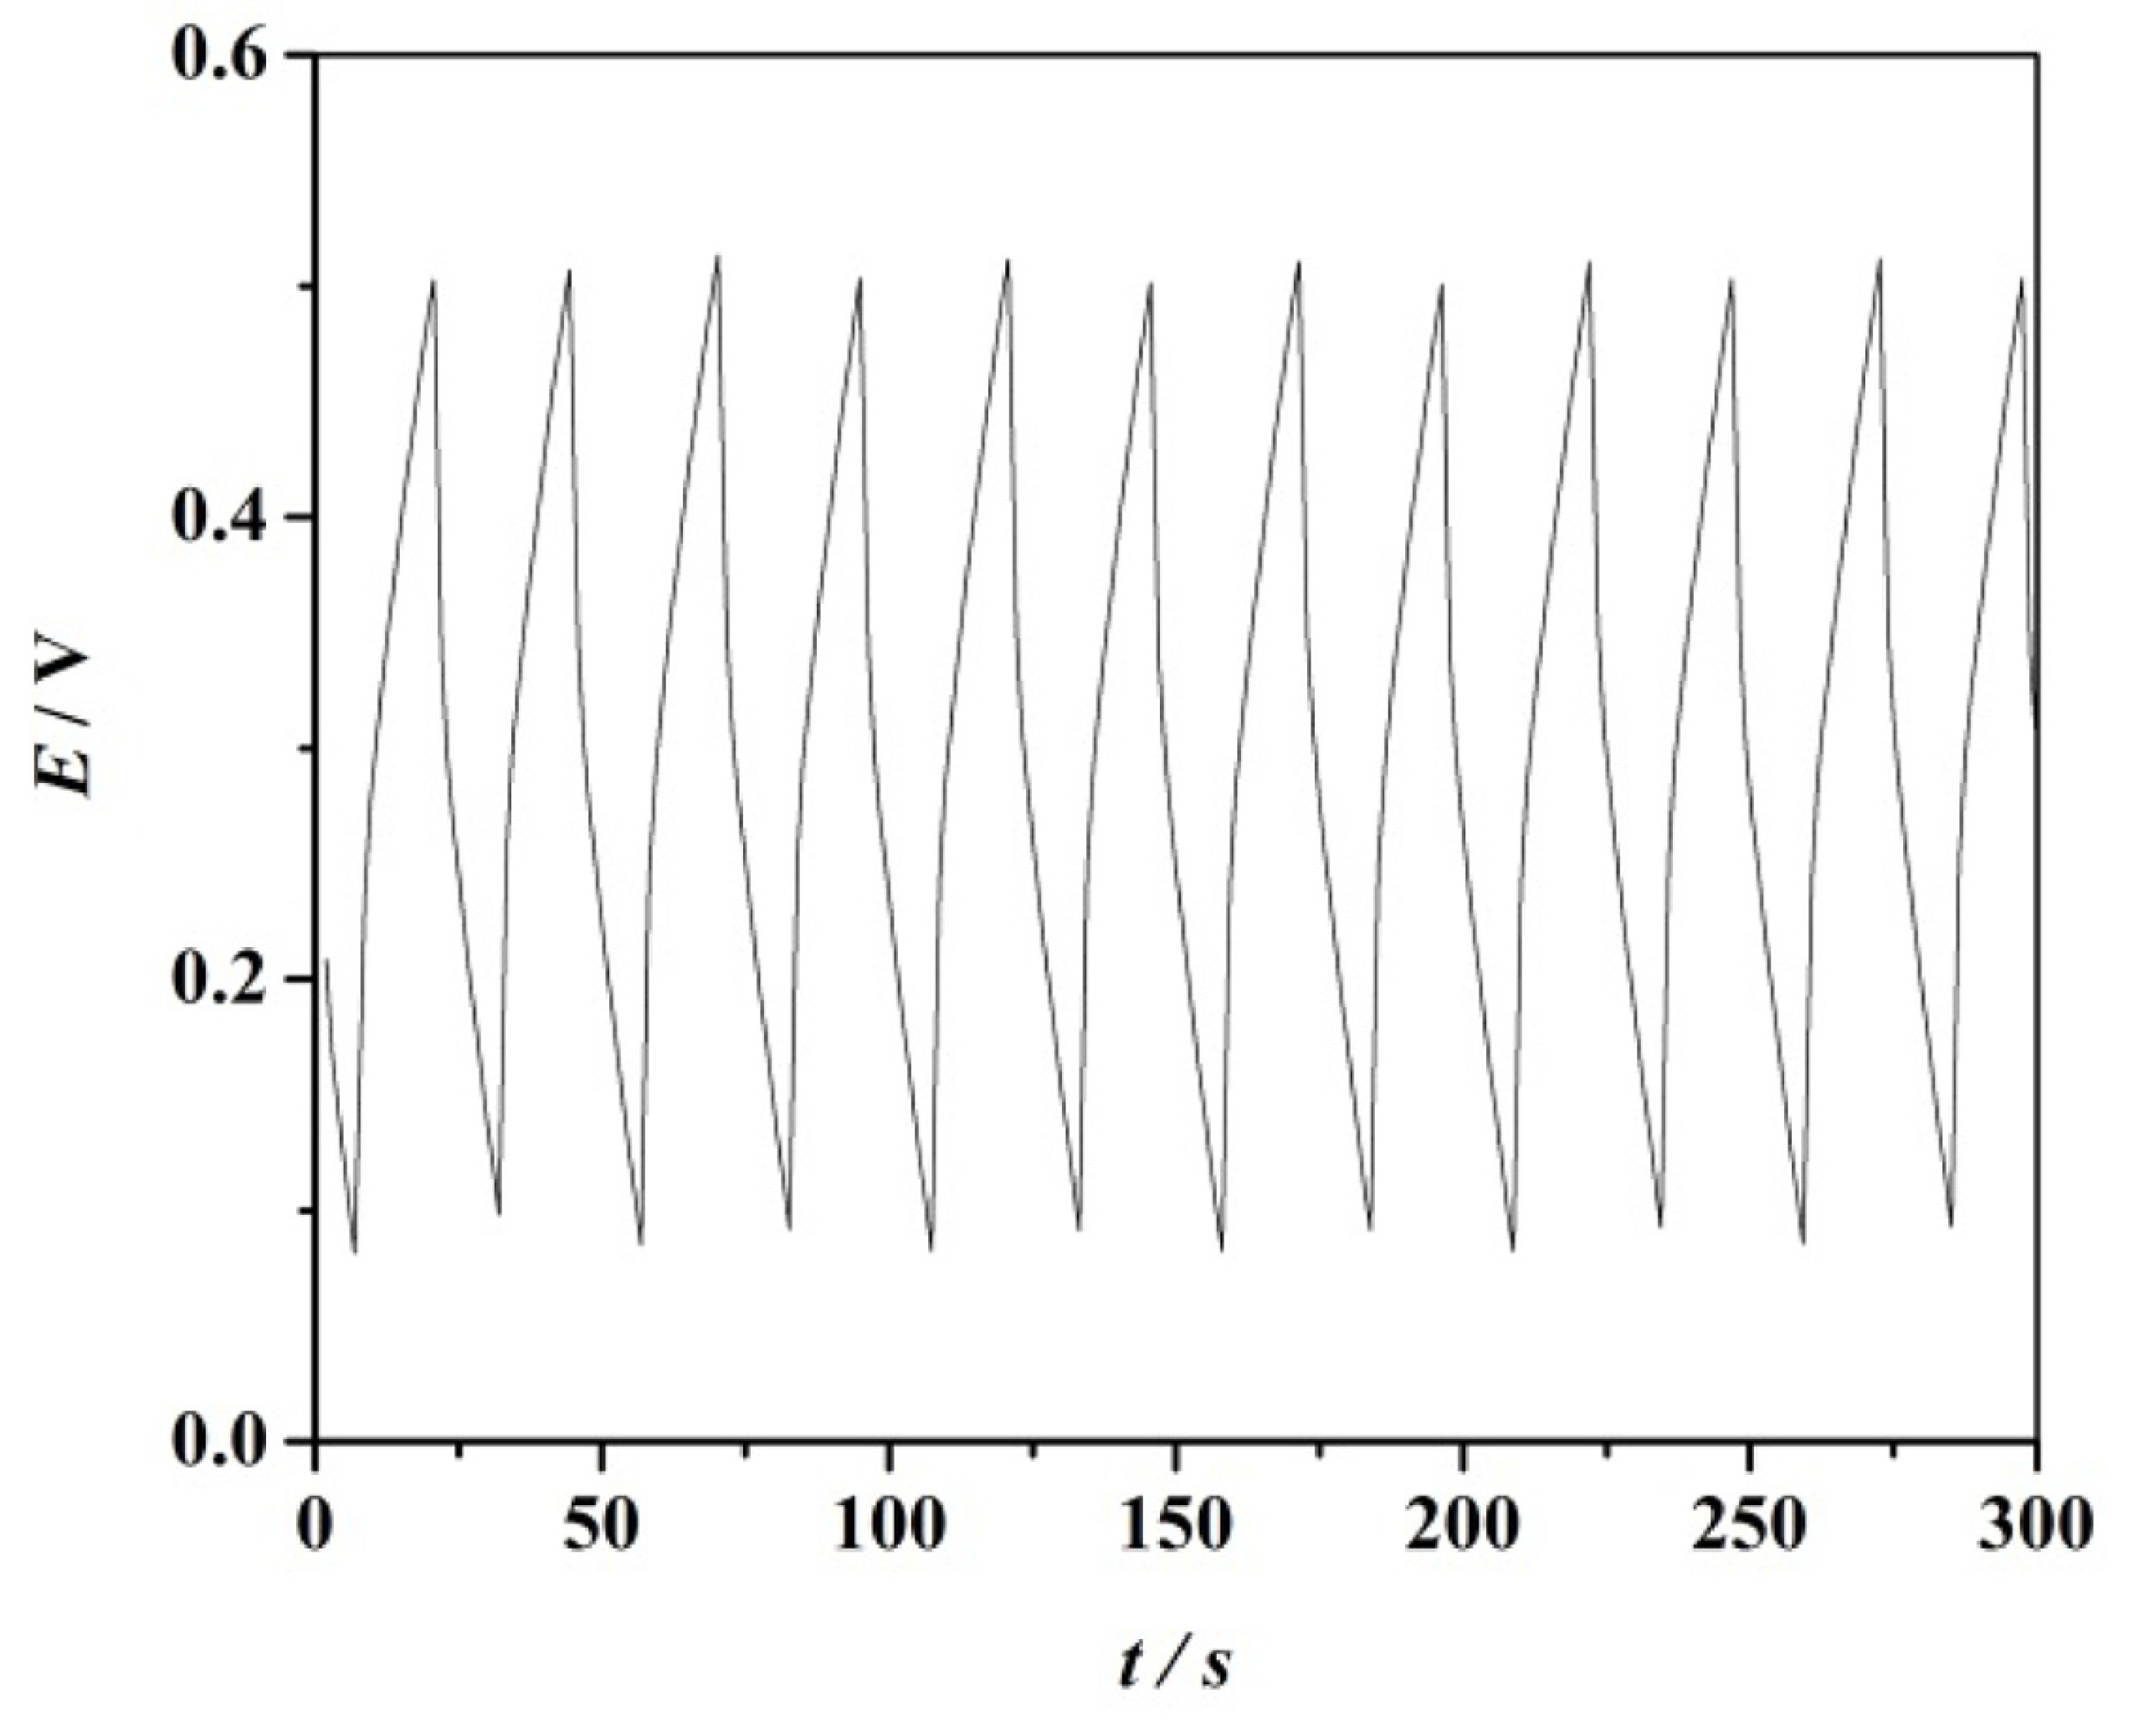
The charge discharge curves are nearly linear and they are symmetric as well. That is an indication of a good capacitive performance [23]. During charging and discharging, an initial sudden change in voltage with respect to time could be observed. Possibly this may be due to ohmic loss across the internal resistance of the cell which is commonly named as equivalent series resistance (ESR) [21].
In CV test, it was possible to do cycling in the potential window −1.5 to 1.5 V. But, for GCD, charging and discharging could not be done in that potential window. It took a longer duration for charging and also, discharging was very quick in that potential window. When doing CV tests, cycling is performed at a certain scan rate. So, the processes are forcibly taken placed. At GCD test, under a constant current, charging and discharging processes taken place between two potentials. There is no external force for the two processes. Due to that reason, it may not be possible to perform the two tests in similar potential windows. The average discharge capacitance calculated was about 69.8 F/g. This value is somewhat higher than the value we have reported for a redox capacitor based on PAN : EC : PC : magnesium chloride (MgCl2) [16].
The capacity fade over 1000 cycles was rather a low value of 4%. This showcases the efficient charging and discharging capability of the pseudo capacitor investigated in the present study.
4. Conclusions
Correct amounts of PAN, EC, PC and NaSCN are essential to obtain high conducting and dimensionally stable GPE film suitable to fabricate pseudocapacitors. It was possible to get the highest room temperature conductivity of 1.92 × 10⁻³ Scm−1 with the sample of composition, 202.5 PAN : 500 EC : 500 PC : 35 NaSCN (weight basis). And also, GPE films were thin and flexible. Moreover, GPE was predominantly an ionic conductor which is one of the most essential key requirements needed to be served as an electrolyte in devices. PPy electrodes were having a porous structure which is favourable for storing charges. The fabricated pseudo capacitors in the configuration, PPy : ClO4 / PAN : EC : PC : NaSCN / PPy : ClO4 exhibited considerable capacitive behavior. The interfacial contact between GPE and PPy electrodes were seemed to be stable. The GPE and conducting polymer combination investigated under this study is suitable for pseudo capacitor applications. Further studies are being conducted to improve the performance.


