


1. Introduction
Redox flow batteries (RFBs) have been studied as large-scale energy storage systems for renewable energy resources such as solar power, wind, et cetera [1-3]. These batteries operate chemically via redox reactions between two electrolytes pumped through an electrochemical cell comprising an electrode, membrane, and bipolar plate. Vanadium redox flow batteries (VRFBs) have attracted considerable attention owing to their reliable performance with low degradation [4,5]. The VRFB, which has an open-circuit voltage of 1.26 V, employs VO2+/VO2+ and V2+/V3+ redox couples as the positive and negative cells, respectively. Carbon materials such as graphite felt, carbon cloth, and carbon fibers are used as electrodes for VRFBs; these materials play an important role in supporting the chemical reaction to achieve good performance of the VRFB system. Moreover, many attempts have been made to enhance the electrochemical kinetics and reversible properties of the electrode by thermal, acidic, and galvanic treatment, as well as by deposition of metallic particles on the carbon surface [6-10]. Here, thermal treatment is highlighted as one of the most attractive common methods for commercial applications, where the focus is on the activity of the surface functional groups and surface area. Earlier studies with rayon-based felts were conducted by heating in the range of 200 to 500 °C for 10 to 50 h under air atmosphere. Sun and Skyllas-Kazacos explained the improved wettability of activated felts in terms of the establishment of functional oxygen groups [11]. Shen et al. developed a graphite felt electrode modified with tungsten trioxide (WO3) to improve the electrochemical reaction of the VO2+/VO2+ redox pair on graphite felt using a hydrothermal method [12]. Furthermore, recent studies have focused on the use of oxygen in the gas mixture to reduce the duration of the heating process, where carbon paper was treated at 400 °C for 15 h in a 21%-42% oxygen environment [13]. However, the expensive mixture gas reduces the overall cost saving of this process. On the basis of these investigations, the electrochemical activity of the electrode surface has generally been attributed to the concentration of oxygen groups on the surface and the surface area. However, the interrelationship among the electrochemical activity, the effect of the amount of oxygen employed for thermal treatment, and the surface area has not been conclusively verified.
In this study, the essential properties of carbon felt electrodes that affect the electrochemical activity are investigated by employing various thermal treatment conditions; bare carbon felts are modified by treatment at 500 °C for 4 h in a mixed gas (21% O2 + 79% N2) under air atmosphere and airless conditions.
2. Experimental Section
2.1 Sample preparation
Untreated carbon felts (PAN, CNF Inc., Korea) were used as the bare (unmodified) material (5.0 cm × 5.0 cm × 0.3 cm) for heat treatment. The first sample (denoted as TFPO) was treated thermally in a tube furnace at 500 °C for 4 h under a mixed gas comprising 21% O2 and 79% N2 at a flow rate of 500 cc×min−1. Before this treatment, the carbon felt electrodes were purged in a tube furnace (Plus Ko-Lab) under a mixed air gas of O2 and N2 for 1 h. The second sample (denoted as BFWA) was thermally treated in a normal box furnace (Daihan Scientific, Model FP-03) without additional airflow using the same temperature and time; that is, the sample was treated with mild oxidation, because the box furnace is not designed to be fully closed. The third sample (denoted as TFWO) was thermally treated in a tube furnace without any gas flow for the same temperature and time; the tube furnace (Plus Ko-Lab) is designed not to allow air from outside to enter, and heat treatment was conducted without any gas supply in the absence of vacuum. Moreover, the tube furnace was not purged with any inert gas or evacuated before it was fully closed. All the carbon felt samples were modified at the desired heating temperature at a heating rate of 10 °C·min−1, and the furnaces were cooled to room temperature automatically; the samples were employed as electrodes to evaluate their electrochemical characteristics.
2.2 Sample characterization
The crystal structures of the graphite materials were studied using X-ray diffraction (XRD; XPert Pro, PANalytical, Netherlands) by employing Cu-Kα radiation (λ = 1.5406 Å). The lattice parameters and crystallite size were estimated by the Rietveld refinement method. The morphology of the carbon felts was observed using field emission scanning electron microscopy (SEM; HITACHI S-4700, Japan), and the surface area of all the samples was measured by Brunauer-Emmett-Teller (BET) analysis using a Micromeritics ASAP 2020 accelerated surface area and porosimetry analyzer. X-ray photoelectron spectroscopy (XPS, Thermo Scientific, USA) was used to characterize the surface chemistry (such as the elemental composition and chemical state of the elements on the surface) of the carbon felt after various surface modifications.
2.3 Electrochemical measurements
Cyclic voltammetry (CV) measurements were performed on an SI 1260 analyzer (Solatron, England) with a three-electrode system using carbon felt with a diameter of 1.4 cm as the working electrode, Pt wire as the counter electrode, and a standard calomel electrode with a Luggin capillary as the reference electrode using a 0.3 M VOSO4 + 0.5 M H2SO4 solution. Electrochemical impedance spectroscopy (EIS) measurements were conducted in the frequency range of 0.01 Hz to 10 kHz with an AC amplitude of 5 mV at the open-circuit potential.
Constant-current charge-discharge tests of the RFB were performed on a WPG 100e (Wonatech Co., Korea) battery test system. Two pieces of carbon felt with an area of 25 cm2 each (5.0 cm × 5.0 cm) served as the positive and negative electrodes; a Nafion-117 membrane (Dupont, France) served as a separator. Fifty milliliter aliquots of 1.6 mol·L−1 of the electrolyte in a 2.5 mol·L−1 H2SO4 solution (OCI, Korea) were stored separately in two tanks (anolyte and catholyte) before the electrochemical measurement. The electrolytes were converted into the anolyte (V2+/V3+) and catholyte (VO2+/VO2+) during the charge and discharge test. The flow rate was kept at 30 mL·min−1, and the test temperature was 25 °C. The cells were galvanostatically charged and discharged in the voltage range of 1.0-1.6 V at a current density of 40 mA·cm−2.
3. Results and Discussion
3.1 Morphology and structural characterization
The surface morphology of the carbon felt was observed before and after modification. Fig. 1 shows SEM images of the unmodified sample (Fig. 1a); the TFPO sample (Fig. 1b), which was treated under a mixed gas (21% O2 + 79% N2) in a tube furnace; the BFWA sample (Fig. 1c), which was treated in a normal box furnace without air flow; and the TFWO sample (Fig. 1d), which was treated under airless conditions in a tube furnace. As shown in Fig. 1b, the microstructure of the TFPO sample was characterized by the roughest surface among the samples, whereas the BFWA sample exhibited moderate surface roughness. The surface of the TFWO sample was smooth, and the microgrooves were almost undetectable.

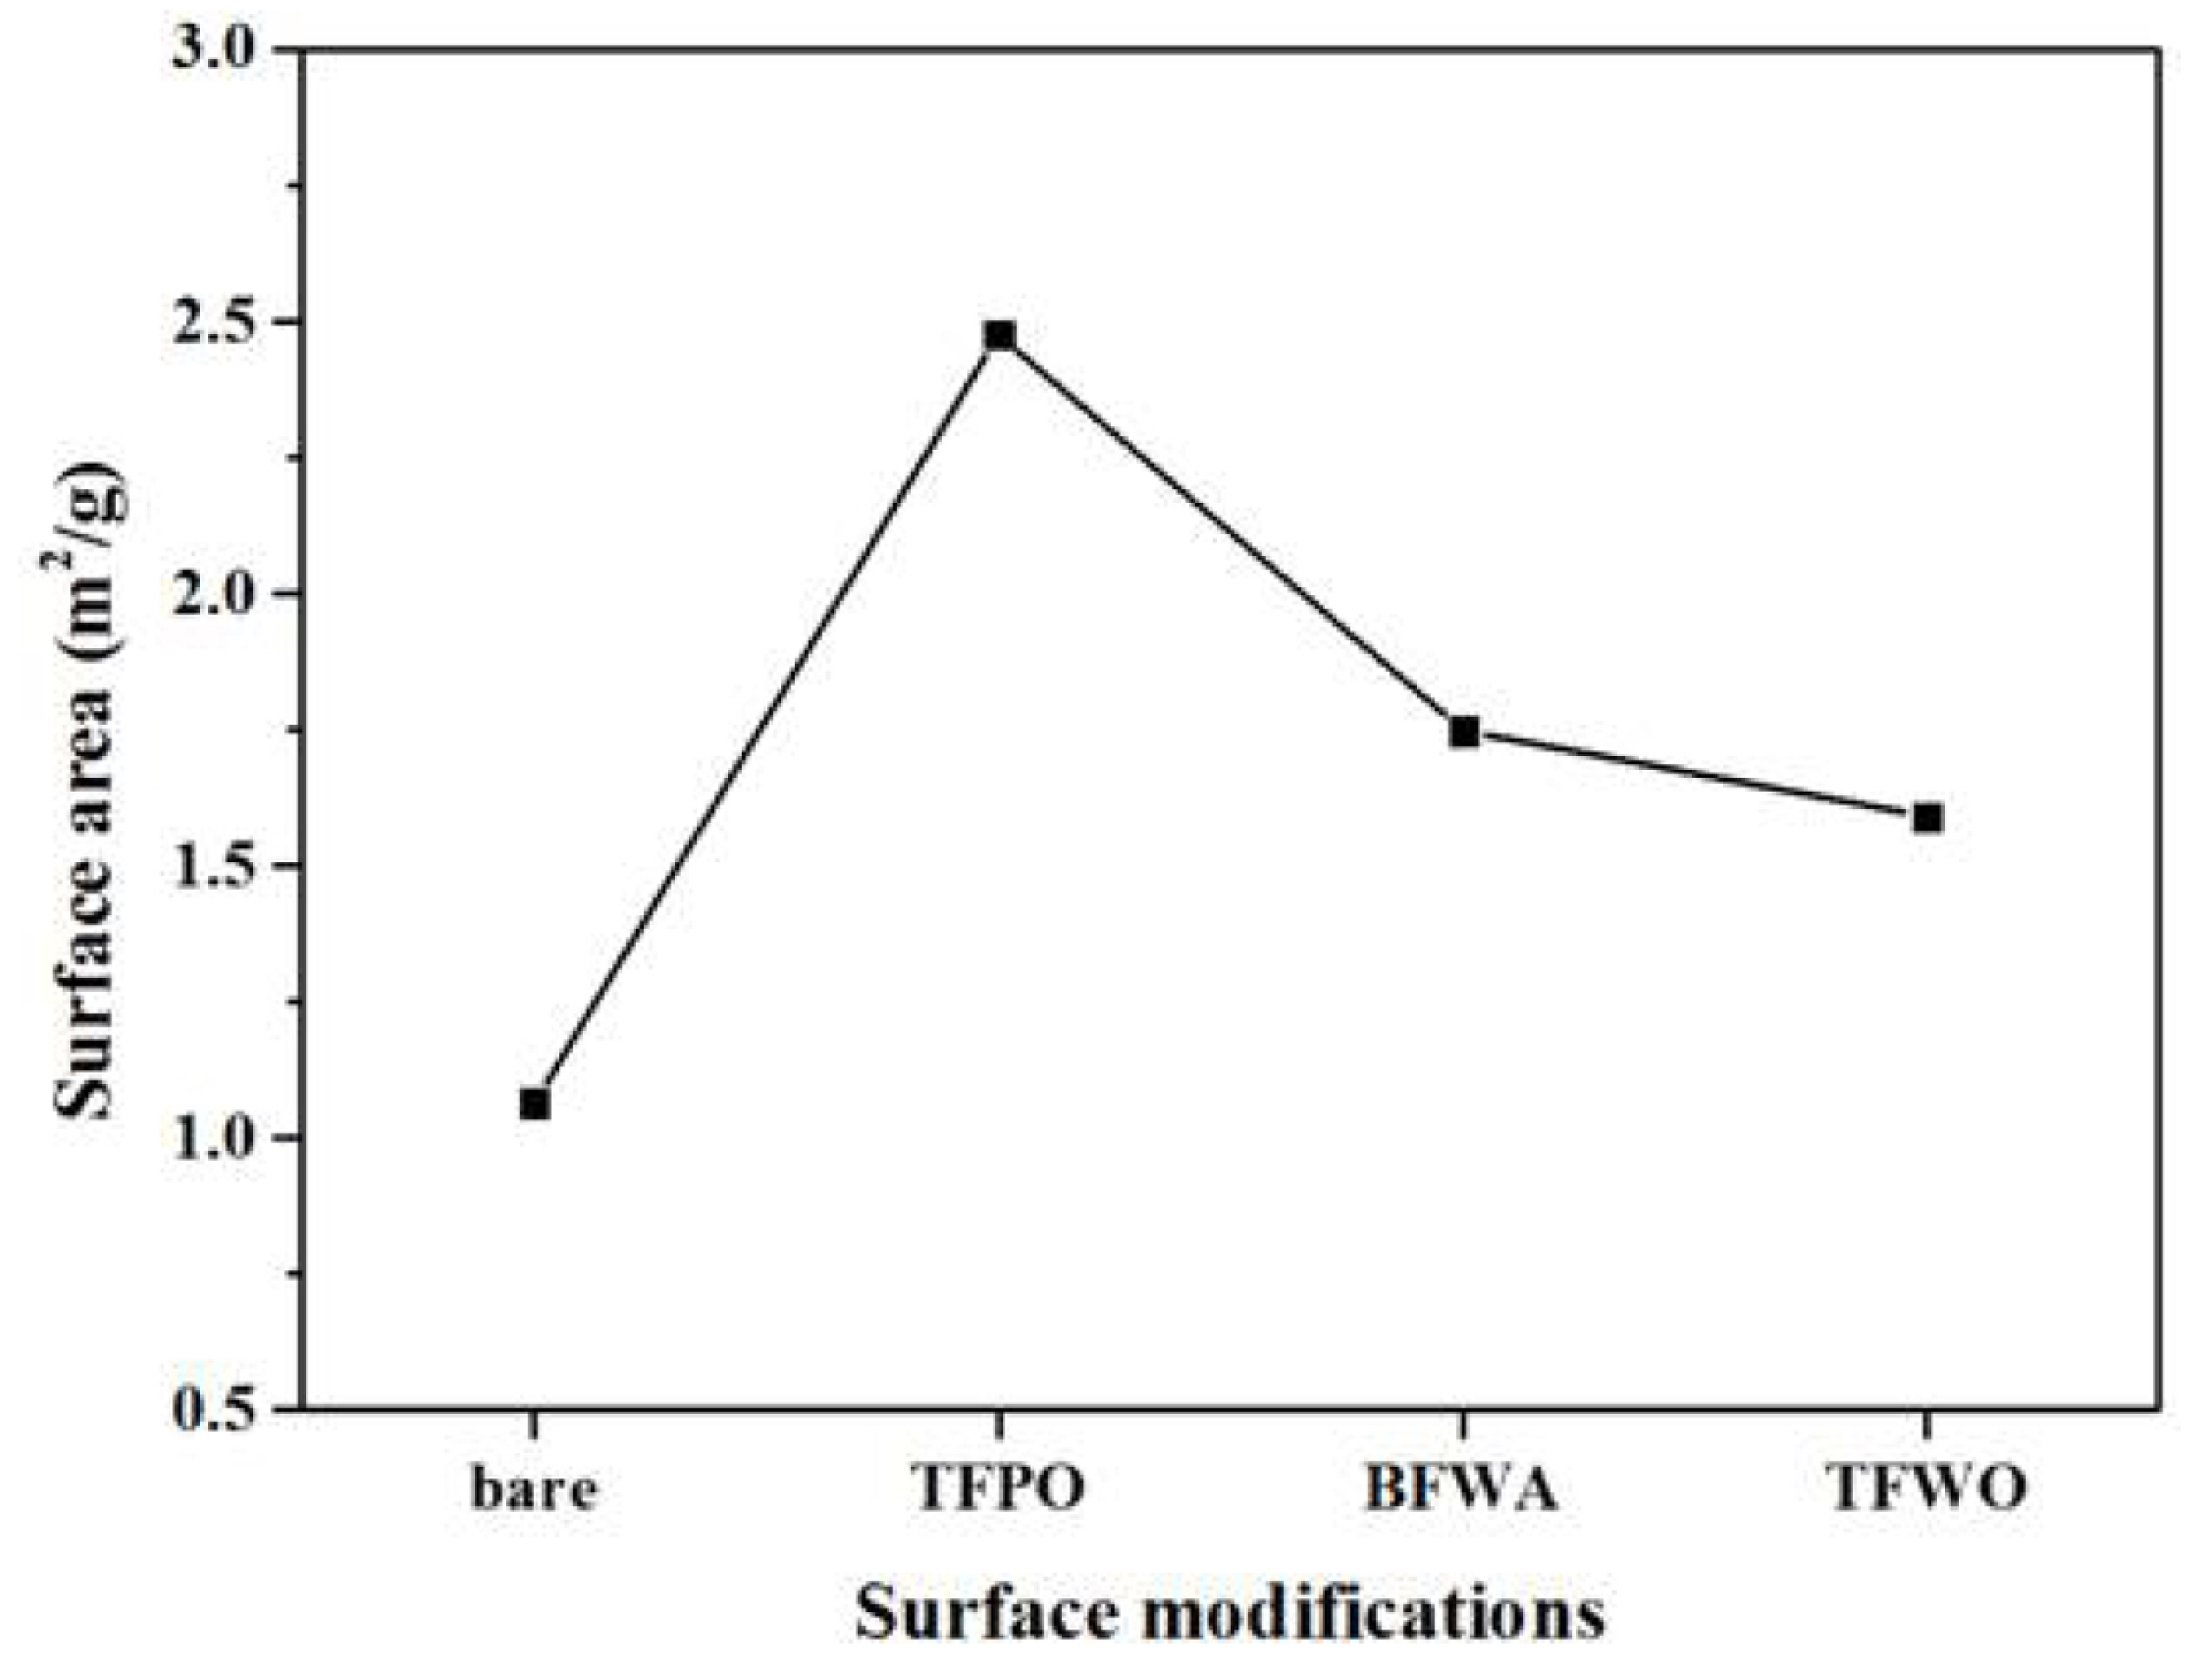
To further investigate the morphological changes, the specific surface area of the carbon felts was evaluated by BET analysis, as shown in Fig. 2. The surface area of the carbon felt increased notably after treatment under mixed gas (232% vs. bare sample) and without airflow (164%). The TFWO carbon felt sample (treated under airless conditions) had the lowest surface area (149%) among the samples. Therefore, the surface roughness and area of the carbon felt were found to depend on the oxygen content of the mixed gas. The weight loss of the TFPO, BFWA, and TFWO carbon felt samples after surface treatment was measured as approximately 5.0%, 0.5%, and 2.0%, respectively. Notably, the surface of the carbon felt could be easily oxidized under a high oxygen content, leading to greater carbon loss from the surface via CO and/or CO2 evolution.
The carbon felt samples before and after thermal treatment were characterized by XRD analysis (Fig. 3). All of the peaks could be indexed to the typical hexagonal (ICSD 98-005-3781) structure, indicating a pure single phase of graphite.

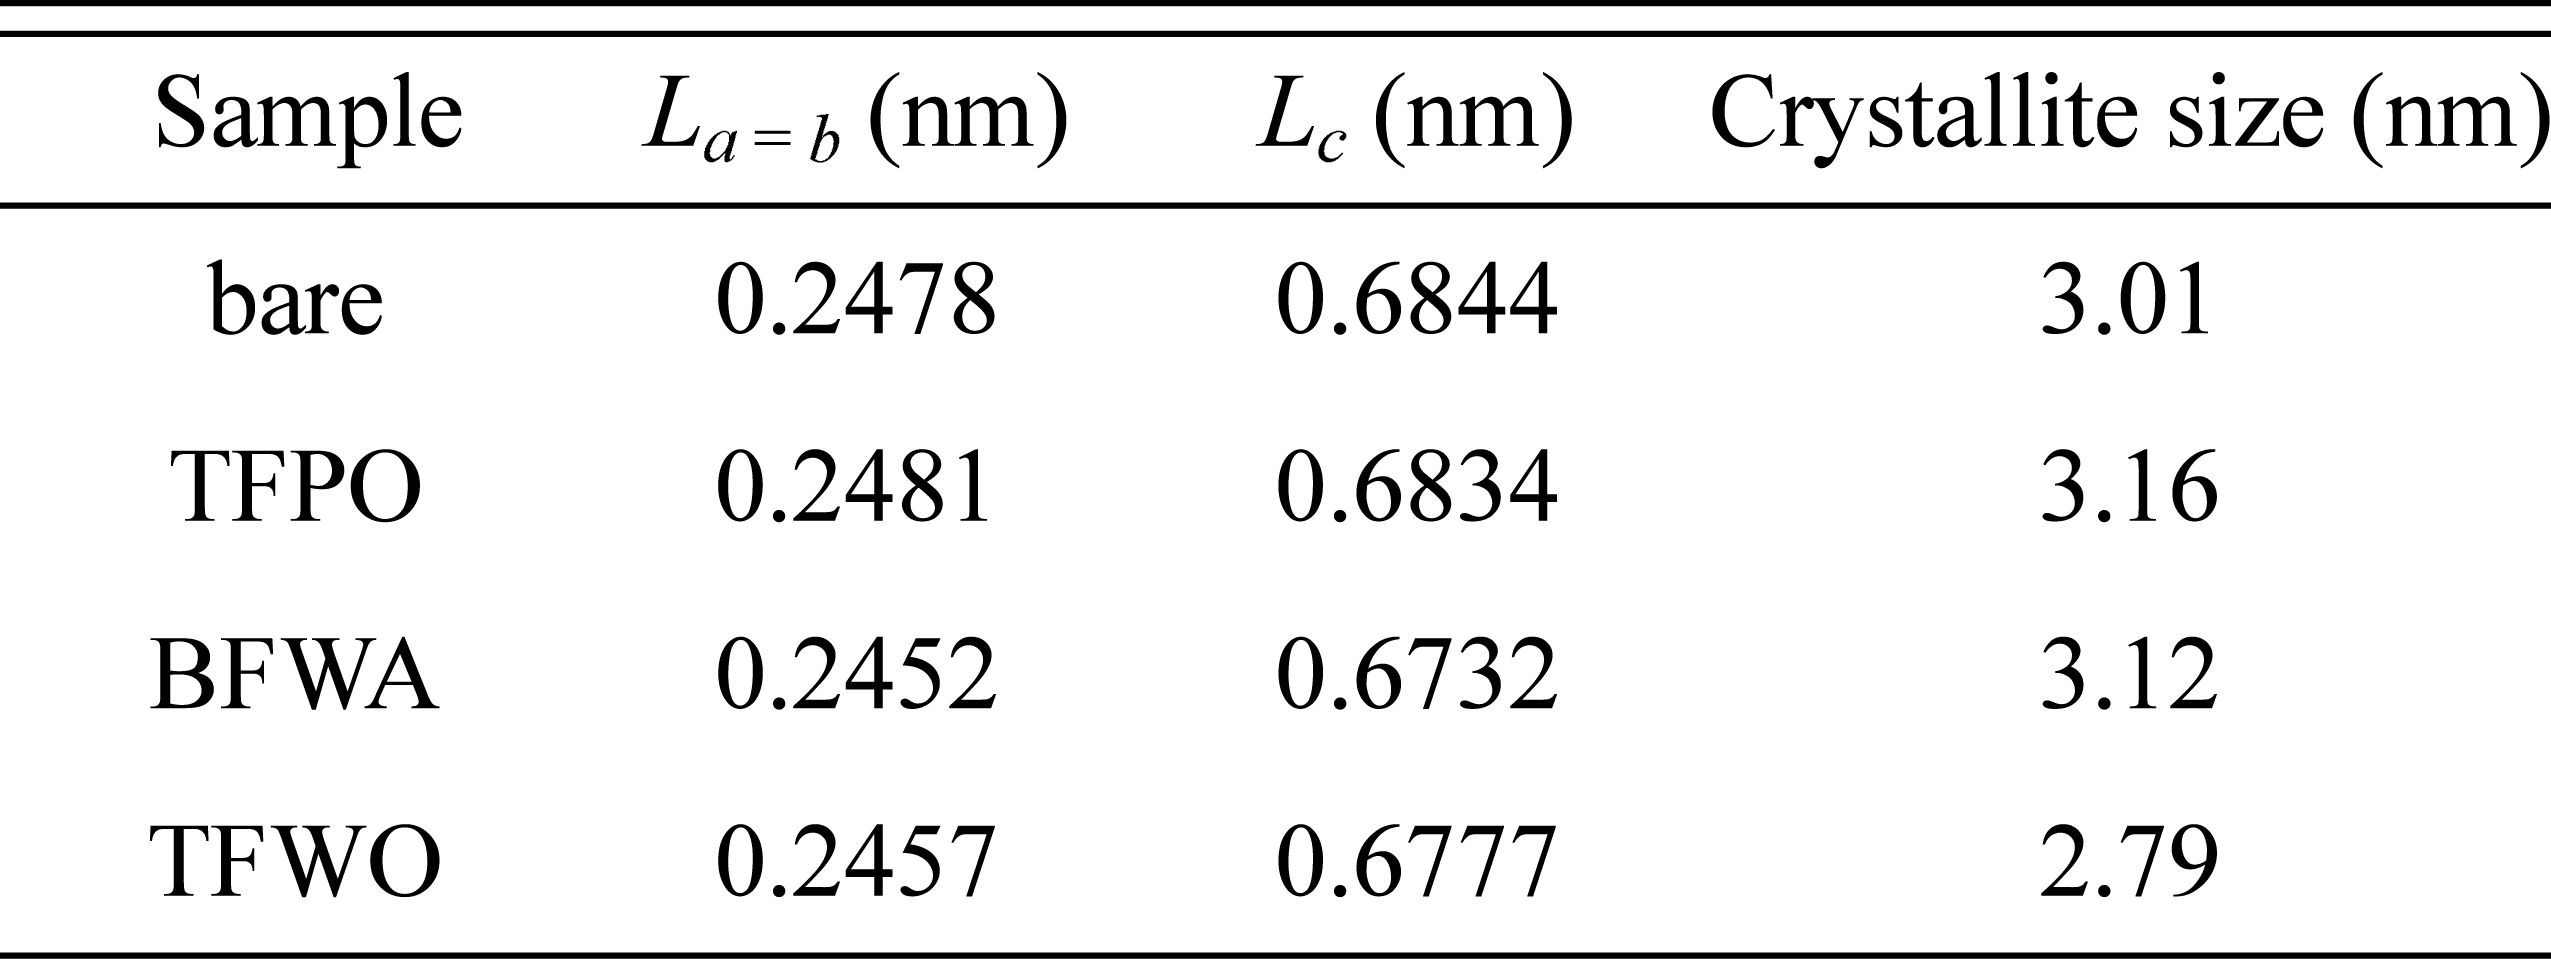
The most intense diffraction peak for all the samples was that of the (002) plane, located at 26.4°. The two weak diffraction peaks at about 43.5° and 54.3°correspond to the (100) and (004) planes, respectively [14]. Compared with the XRD pattern of bare carbon felt, the XRD pattern of the TFWO sample showed a slight decrease in the diffraction intensity, and the peaks were shifted to the right. The lattice parameters and crystallite size of all the carbon felts were obtained by Rietveld refinement. As shown in Table 1, the lattice parameters and crystallite size varied depending on the sample, where the dimensions of the a = b and c axes of BFWA and TFWO were smaller than those of the TFPO sample. Furthermore, the crystallite size of the TFWO sample decreased more steeply than that of the other samples. These results demonstrate that more structural defects were introduced by modification under airless conditions.
3.2 Surface chemistry
Figure 4 shows the C and O XPS spectra, which indicate the surface chemical state of the carbon felts before and after the modification processes. The O 1s peak could be deconvoluted into 3-5 peaks in the range of 528-539 eV, where the first peak, around 533-534 eV, is attributed to the phenolic (C-O and/or C-OH or C-O-C) groups, and the second peak, around 531-532 eV, can be assigned to the carboxylic and carbonyl (C=O) groups. The additional peak around 535-536 eV may be ascribed to absorbed water and some chemically absorbed oxygen [15-18]. The intensity of the O 1s-A peak of the TFPO and BFWA samples (which is related to the C-O group) increased, whereas that of the O 1s-B peak (C=O group) declined in comparison with that of the bare sample (Fig. 4a-c). It seems that the surface of the carbon felt changed because of CO and/or CO2 evolution [19]. The TFWO sample exhibited different behavior, as shown in Fig. 4d. The intensity of the peaks related to the C-O group (O 1s-A) and the C=O group (O 1s-B) decreased, whereas a peak corresponding to the C-OH group (O 1s-C) appeared and became more intense than the peaks of the other samples. Moreover, the profile of the sample showed two additional peaks corresponding to chemisorbed H2O and C-OH groups. The activity toward vanadium species reactions reportedly increases with increasing surface concentration of C-OH functional groups produced on the electrode surface [14,15,17].

From the XPS spectra, it is possible to estimate the surface atomic ratio of C 1s versus O 1s, which provides more information on the functional groups formed by the surface modifications. Fig. 5 shows the O 1s/C 1s atomic ratio for the bare, TFPO, BFWA, and TFWO samples, which had O 1s/C 1s ratios of 1.72, 9.18, 10.45, and 12.83, respectively. It is found that the carbon felt could be more easily functionalized with oxygen by airless treatment than by the other methods.

3.3 Electrochemical evaluations
Figure 6 shows cyclic voltammograms of the carbon felts in 0.3 M VOSO4 + 0.5 M H2SO4 solution acquired at a scan rate of 5 mV·s−1 over five cycles. The oxidation peak of the TFWO sample occurred at 1.0 V, whereas those of the other samples appeared at approximately 1.2 V, indicating the excellent electrochemical activity of the former. The oxidation and reduction peaks are associated with the VO2+/VO2+ couple, where the anodic peaks at 1.0-1.2 V are due to oxidation of VO2+/VO2+, whereas the cathodic peaks at 0.3-0.5 V correspond to reduction of VO2+ to VO2+ [15]. The redox peaks of the bare sample occurred at the lowest energy, even at the fifth cycle. Moreover, the TFWO sample presented a quasireversible and faster kinetic reaction than the TFPO and BFWA samples. The current peak for oxidation and reduction of the TFWO sample displayed a high degree of symmetry: The peak potential separation (DEp) decreased from 0.9 to 0.5 V.

Figure 7 shows the Nyquist plots of the carbon felts in 0.3 M VOSO4 + 0.5 M H2SO4 solution at the open-circuit potential in the frequency range of 0.01 Hz to 10 kHz with an AC amplitude of 5 mV. All the Nyquist plots included a semicircular region at high frequency and a linear region at low frequency, suggesting that the electrochemical process was a combination of charge transfer and diffusion steps.

The high-frequency semi-arc arose from the charge transfer reaction at the electrolyte– electrode interface. The radius of the semi-arc reflects the charge transfer resistance. The low-frequency linear region can be attributed to the diffusion processes associated with the diffusion of VO2+/VO2+ in the pore channel of the electrode [12,20]. The bare sample had the largest semi-arc radius, indicating that it had the largest charge transfer resistance for VO2+/VO2+. The magnitude of the high-frequency semi-arc decreased with increasing oxygen groups on the surface of the carbon felts in moving from the TFPO to the TFWO sample. This result is consistent with the CV results. Thus, both the EIS and CV data indicate that the reaction of the VO2+/VO2+ redox couple was greatly enhanced on the TFWO sample.
Figure 8 shows the galvanostatic charge-discharge profiles at the first cycle of VRFB single cells with the carbon felts before and after modification. A comparison of the charge–discharge curves of the VRFB cells employing the bare, TFPO, BFWA, and TFWO electrodes showed that the VRFB with the bare electrode had a higher charge voltage plateau and a lower discharge voltage plateau than the cells with the other electrodes at the same current density. Moreover, the TFWO electrode exhibited a lower charge voltage plateau and a higher discharge voltage plateau than the other electrodes; thus, the voltage efficiency of the VRFB with the TFWO electrode was higher than that of the VRFB with the other electrodes, suggesting that the oxygen groups on the TFWO electrode reduced the polarization resistance during the charge–discharge process.
Fig. 8.
Galvanostatic charge-discharge profiles of VRFB cells employing bare, TFPO, BFWA, and TFWO samples.
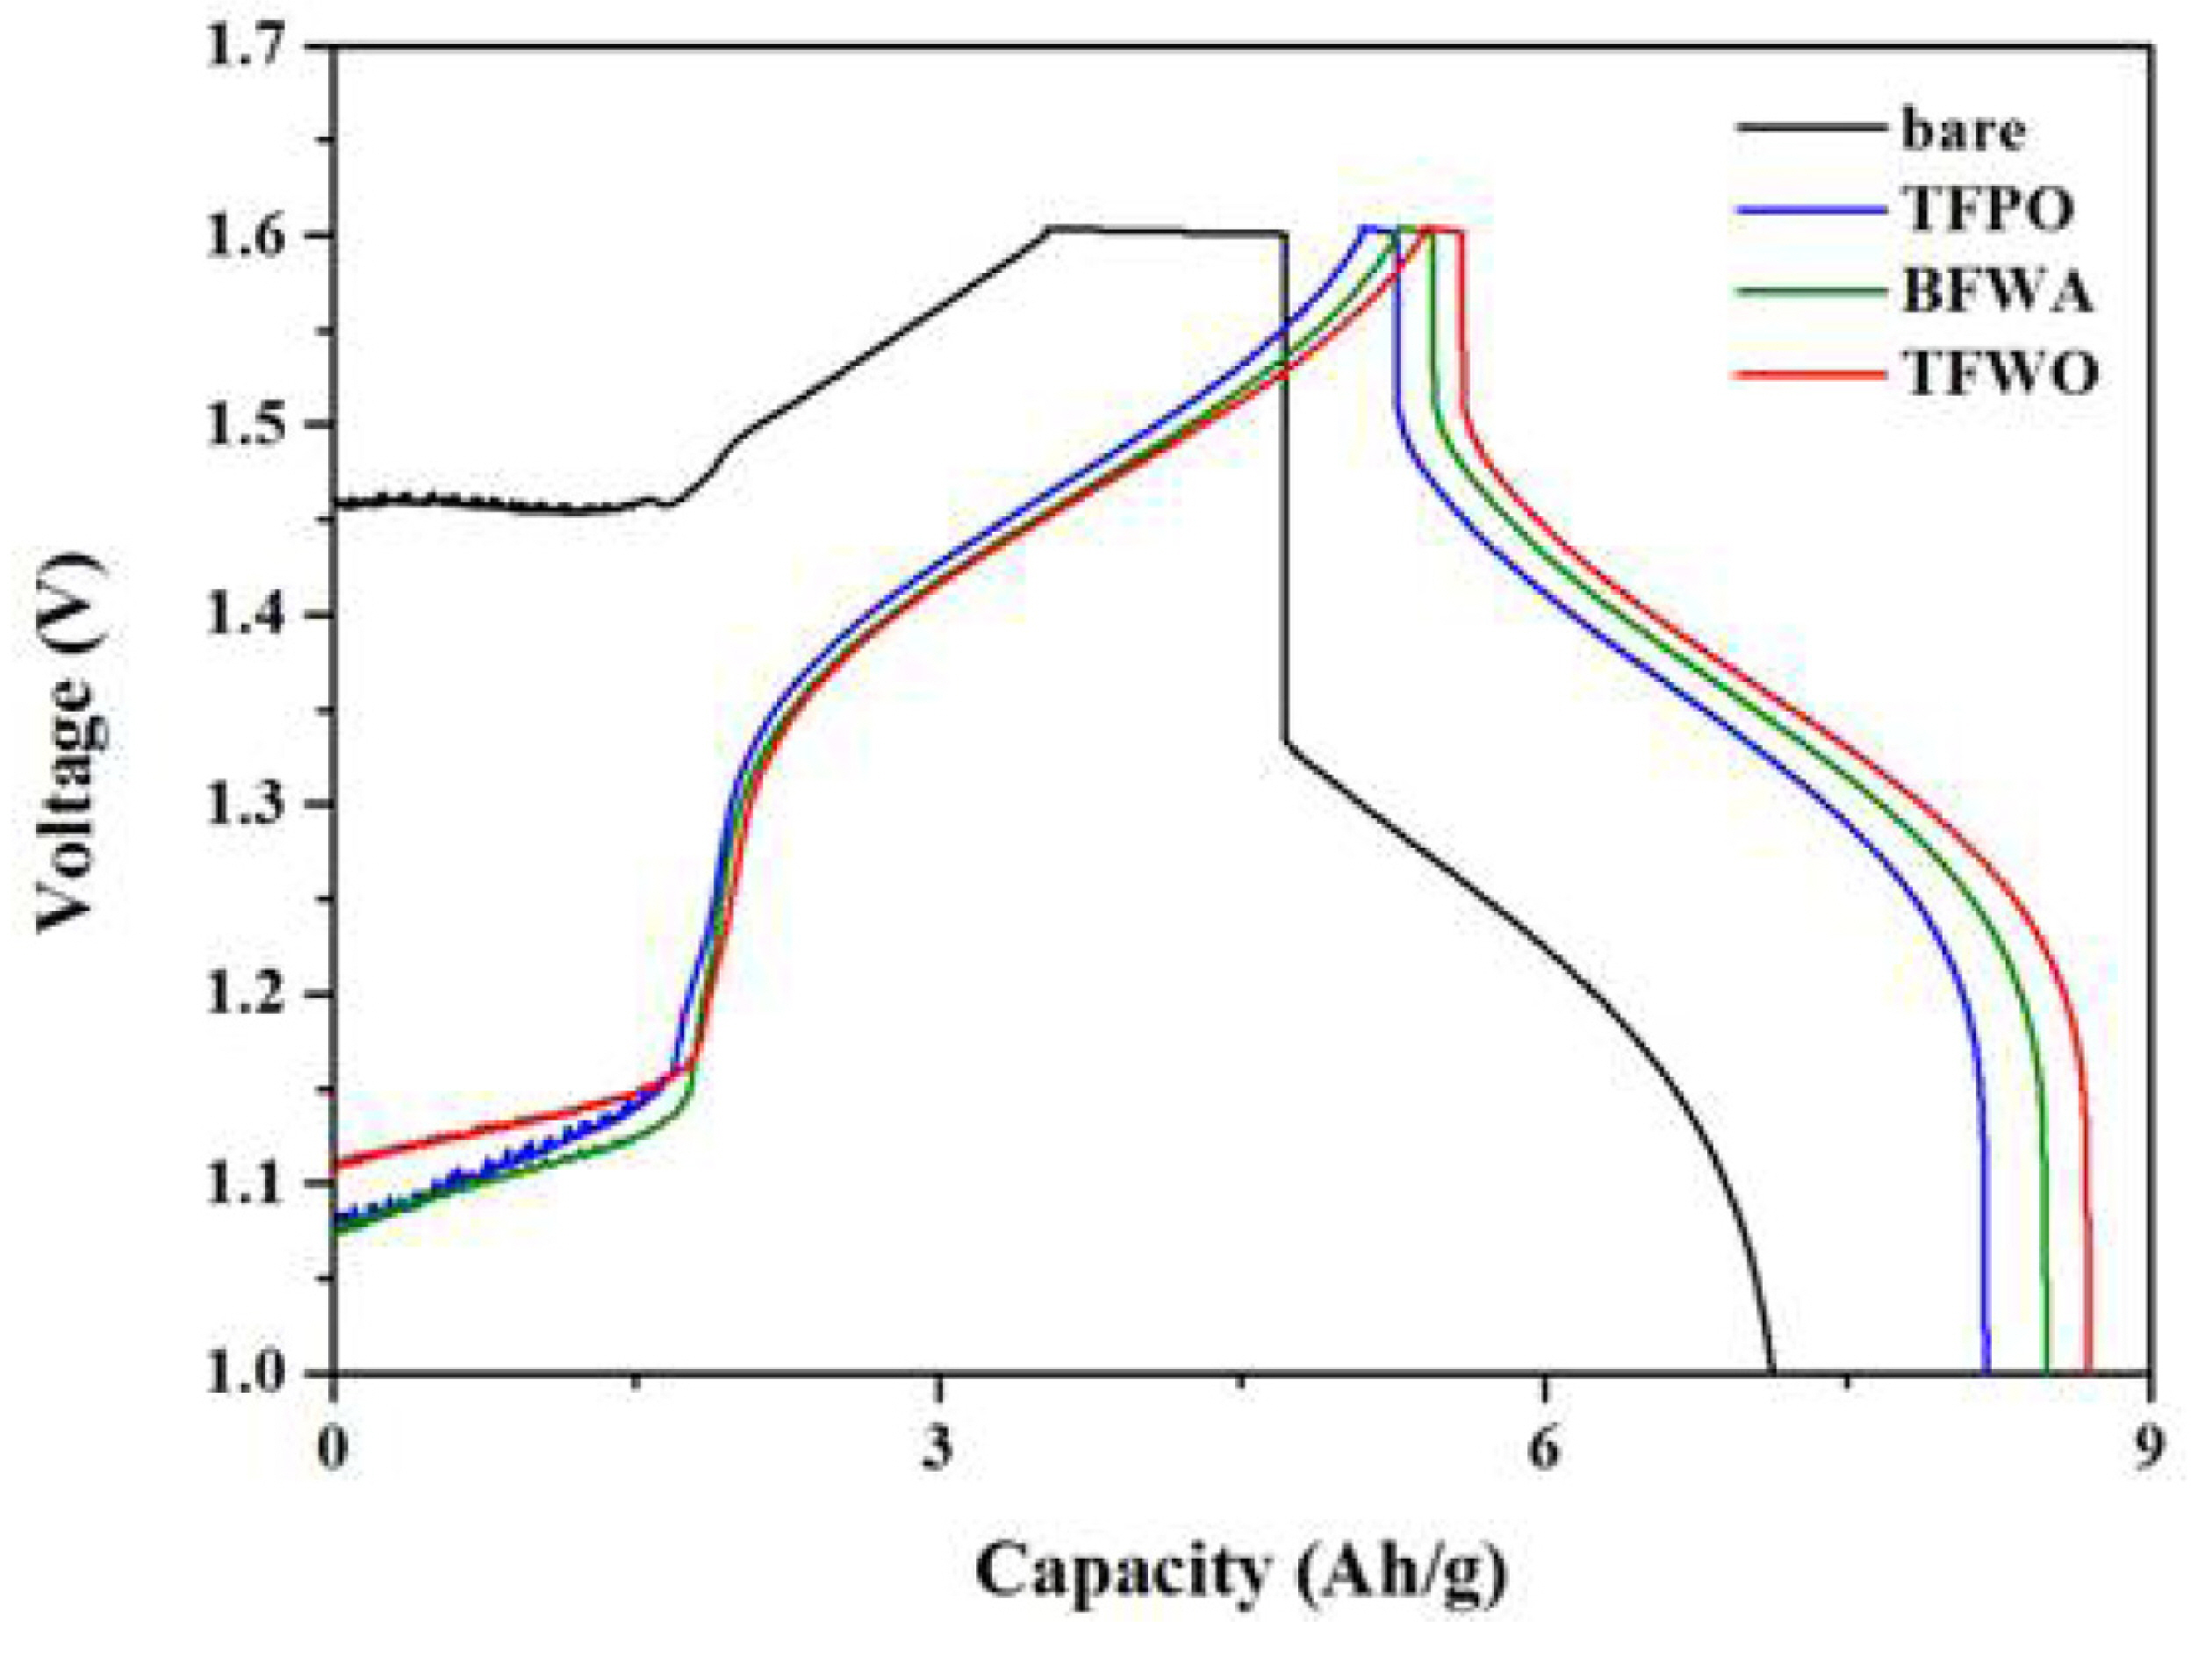
Figure 9 shows the charge-discharge and efficiency profiles of the TFWO electrode during cycling. As shown in Fig. 9a, a large, irreversible charge curve was obtained at the first cycle, which is common to all the samples owing to the oxidation of V3+ to VO2+/VO2+ during the initial charging process [15]. The discharge capacities at the first and second cycles did not differ greatly, unlike the case for the charge process. The Coulombic efficiency (CE), voltage efficiency (VE), and energy efficiency (EE) of the TFWO electrode with cycling are summarized in Fig. 9b. The CE, VE, and EE of the TFWO electrode at the fifth cycle were 89%, 92%, and 82%, respectively, and the EE values of all the samples except for the bare sample were almost the same, indicating their high performance compared with that previously reported for carbon felts [8,19].
Fig. 9.
Galvanostatic charge-discharge profile (a) and efficiency (b) of VRFB cells employing TFWO sample.

These results reveal that although its surface area was relatively small, the TFWO electrode exhibited good electrochemical performance; the essential factor affecting the electrochemical activity of the carbon felt electrodes is the oxygen functional groups, which can, along with the large surface area, provide more redox reaction sites for vanadium ions at a constant flow rate. Therefore, the phenolic group (C-O and/or C-OH or C-O-C) is more effective for increasing the energy efficiency of VRFB cells than the carboxylic or carbonyl groups (C=O) from the thermodynamic point of view.
4. Conclusion
The surface of a carbon felt electrode modified under airless conditions at 500 °C for 4 h was found to possess numerous oxygen functional groups and also a low surface area compared with electrodes treated under other conditions, according to XPS, SEM, and BET analyses. Electrochemical evaluation by CV and EIS confirmed that the electrode had fast kinetics and underwent a reversible reaction with a low charge transfer resistance, resulting in good performance of VRFB single cells. The VRFB cell exhibited an improved energy efficiency of 82% with high electrochemical activity. This study indicates that surface modification under airless conditions provided more oxygen functional groups, which acted as redox reaction sites on the carbon felts.


