


1. Introduction
Electrochemical capacitors, which are also known as ŌĆ£supercapacitorsŌĆØ or ŌĆ£ultracapacitors,ŌĆØ are energy storage devices which can be divided into three main classes; electric double layer capacitors (EDLCs), pseudo-capacitors, and hybrid capacitors [1-5].
Among them, activated carbon based EDLCs, which store electrical charge in thin electric double layers on the interface between activated carbon and electrolytes, are advantageous because of their high power density, unlimited charge/discharge cycle life, and a wide operating temperature range compared to conventional lithium-ion batteries (LIB). On the other hand, they have a comparatively low energy density and high price compared to the LIB [6-11].
To overcome these disadvantages, there have been many studies to develop methods to reduce costs and increase the energy density of EDLC [12-16]. EDLC is comprised with activated carbon (AC) with a high specific surface area and an electrolyte solution with salt, an aluminum (Al) current collector, and a separator as the main components [8,10,17]. Etched Al foil with a 99.9% purity (99.9% Al foil) has been used as a conventional current collector for EDLC. There are various grades of etched Al foil, and in general, the higher the Al purity, the more expensive it is. Because the highest purity foil with a thickness of 50 ╬╝m or less is 99.9% Al, it is the most expensive material that may be considered for etching and use as a current collector for EDLC. Therefore, replacing 99.9% Al foil with that of a lower purity may reduce the overall costs.
However, research from the LIB field has found that the electrochemical stability of Al foil in an electrolyte for LIB decreases as the purity of Al decreases [18], and Al foils of a given purity also exhibit variations in electrochemical stability, depending on the electrolyte used [19-33]. The low electrochemical stability of the current collector in LIB is not as important as in EDLC because of the short lifetime of LIB. However, if Al foil with low electrochemical stability is used as a current collector in EDLC, which requires a long lifetime, the reliability and stability of the cell can be negatively impacted by corrosion reactions with the electrolyte [34-37]. In order to consider lower-grade Al foils as potential current collector for EDLC, their anodic behavior in the electrolyte solution must be well-understood.
In this work, the anodic behavior of various types of etched Al foils with various purities, capacitances, and withstand voltage in EDLC electrolyte solution was investigated. Results from this study led to the fabrication of a low-cost modified Al foil with improved electrochemical stability which could be used as a current collector for EDLC. A constant voltage load test was conducted to evaluate the reliability and stability of the resulting EDLC cells. In addition, to understand the deterioration process of the Al current collector, the standard cells made with conventional Al foil under the constant voltage load test was disassembled every 500 hours, and the surface change of the Al foil was observed.
2. Experimental
2.1. Aluminum foils
Etched Al foils with a thickness of 22 ╬╝m and Al purities of 99.9%, 99.4%, and 98.0%, and a plain Al foil of 99.4% purity were obtained from Korea JCC. Etched Al foil of 99.9% purity is commercially available as a current collector for EDLC, and etched Al foils of 99.4% and 98.0% purity are commercially available as cathode foils for Al electrolytic capacitors.
Specifications of the chemical components are given in Table 1.

2.2. Etching of aluminum foils
Plain Al foils of 99.4% purity were immersed in sodium hydroxide solution (NaOH 10 g/L) at 60Ōäā for 18 seconds, then washed with distilled water. To make etched Al foils with different capacitances, Al plain foils which were pretreated with sodium hydroxide solution were immersed in etching solution (Al = 50 g/L, Cl = 240 g/L, SO4 = 20 g/L) at 60Ōäā for 10, 13, 16, and 23 seconds, respectively, and then immersed in sulfuric acid solution (Al = 10 g/L, SO4 = 120 g/L) at 70Ōäā for 100 seconds. The etched Al foils were cleaned with distilled water and immersed in phosphate solution (Al = 2 g/L, PO4 = 20 g/L) at 70Ōäā for 40 seconds to complete the final chemical treatment. Etched Al foils were washed with distilled water and dried in an electric muffle furnace (C-FMD, from Chang-Shin Science) at 300Ōäā for 10 minutes.
Etched Al foils with capacitances of 60, 110, 140, and 210 ╬╝F/cm2 were prepared. Al foils with a purity of 99.4% with various capacitances were named according to each capacitance: 210 ╬╝F/cm2 as Al foil-210 ╬╝F, 140 ╬╝F/cm2 as Al foil-140 ╬╝F, 110 ╬╝F/cm2 as Al foil-110 ╬╝F, and 60 ╬╝F/cm2 as Al foil-60 ╬╝F.
The foil names according to capacitance are shown in Table 2.

2.3. Forming of etched aluminum foil
The forming solution was prepared by mixing 1000 ml of distilled water and 150 g of ammonium adipate to ensure a specific resistance of 6.5 ┬▒ 15 ╬® cm (at 70Ōäā) and pH of 6.7 (at 50Ōäā).
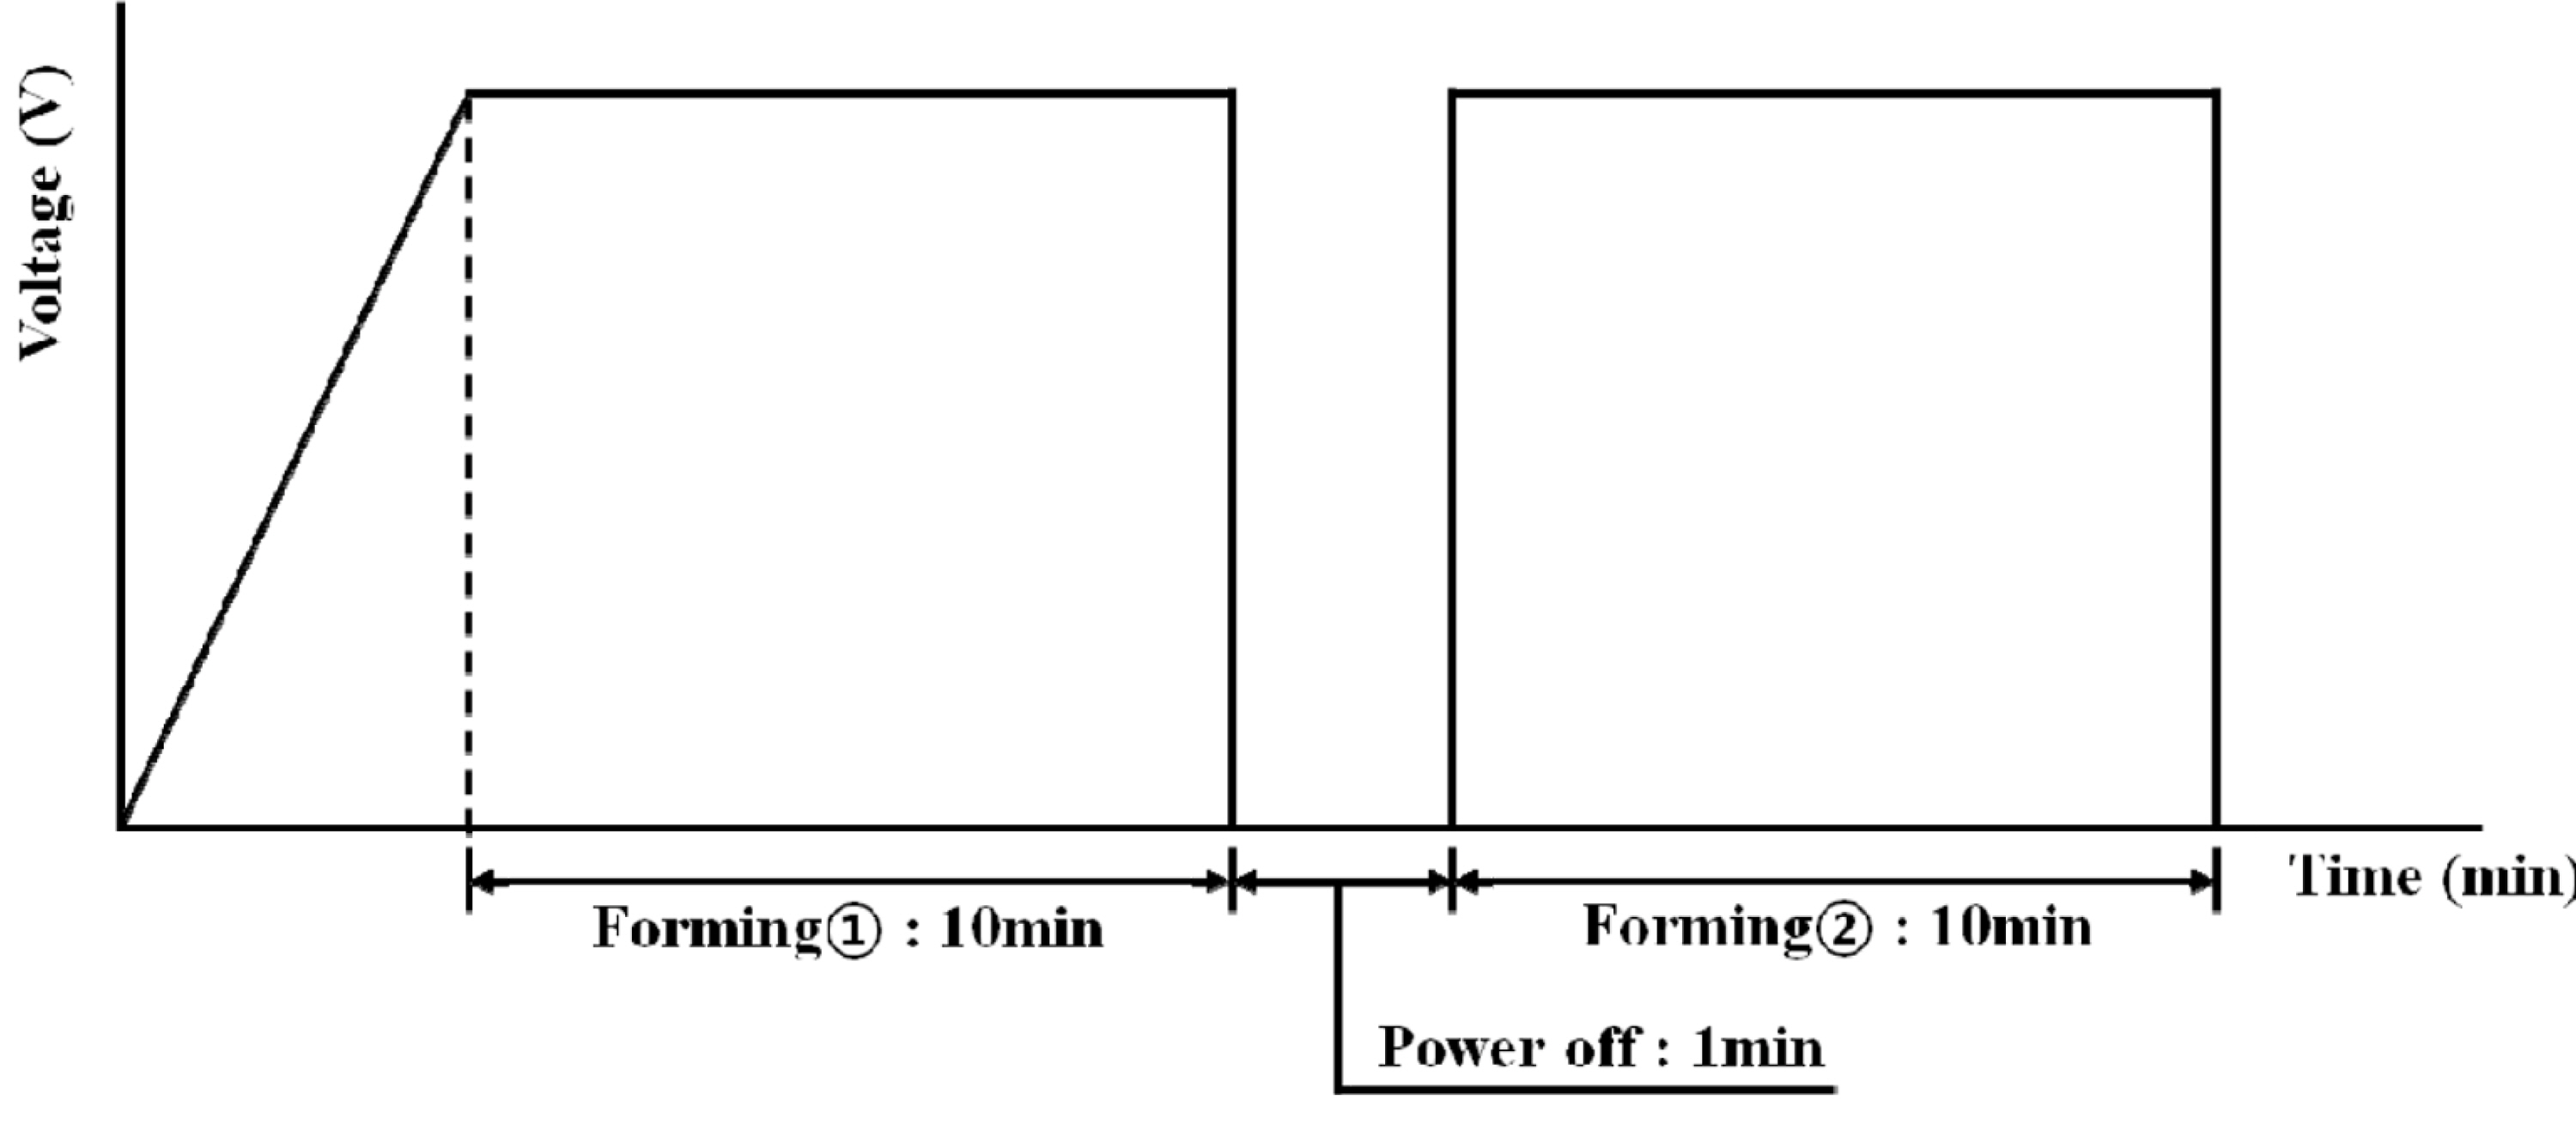
After immersing the Al foil in the forming solution at 65 ┬▒ 2Ōäā, and a DC current of 10 mA per 1 cm2 was applied to the Al foil until desired voltage was reached.
After maintaining the voltage for 10 minutes, the power was turned off and left for 1 minute. The power was then reapplied, and when the voltage reached the desired value, it was maintained for 10 minutes before forming was terminated. The resultant Al foil was cleaned with distilled water and dried. The voltage application procedure is shown in Fig. 1.
Unformed etched Al foil with capacitance of 110 ╬╝F/cm2 (hereinafter called as Al foil-0Vf) was formed from the 99.4% Al foils obtained from Korea JCC according to the forming process described above to have withstand voltage of 1 Vf and 3 Vf, respectively (hereafter called as Al foil-1Vf and Al foil-3 Vf).
The characteristics of the Al foils prepared for electrochemical stability testing according to the withstand voltage, are shown in Table 3.

2.4. Cyclic Voltammetry and Chronoamperometry
Cyclic Voltammetry (CV) and chronoamperometry (CA) experiments were performed to investigate the Al corrosion phenomenon in the non-aqueous electrolyte solution used in EDLC. All measurements were made at room temperature using a multichannel potentiostaticŌĆōgalvanostatic system (VSP-300, from Biologic Science Instrument).
CV experiments were conducted by a 3-electrode system. The 3-electrode system consisted of an activated carbon electrode as the quasi-reference electrode (AC QRE) and counter electrode and Al foil as the working electrode. The sweep rate was 0.166 mVs-1.
The CA experiments was conducted at an applied potential of 3.5 V on a 2-electrode system (SB-8 from EC frontier). AC QRE was used as a counter electrode. In addition, Al foil and acetonitrile (ACN) solution containing 1 M tetraethylammonium tetrafluoroborate (TEABF4) were used as the working electrode and electrolyte, respectively. The potential was applied for a total of 24 h.
Assembly of the 3-electrode system and 2-electrode system and electrochemical experiments were conducted in an inert atmosphere (high-purity Argon filled glove box), ensuring ambient water and oxygen concentrations of less than 2 ppm. In this paper, the electrode potential is described as the potential vs. Li/Li+ for convenience.
2.5. Electrodes and cells preparation
The EDLC electrodes were made using activated carbon (84 wt.%, MSP-20 from Kansai), carbon black (10 wt.%, Super-P from Timcal), PTFE (1.5 wt.%, polytetrafluoroethylene from Daikin), SBR (2.5 wt.%, styrene butadiene rubber from Zeon), a viscosity agent (2 wt.%, carboxymethylcellulose from Dahchi, and a separator (TF4840 from NKK). ACN solution containing 1 M TEABF4 with a water concentration of less than 10 ppm was used as the electrolyte solution. The electrodes were dried in a vacuum for 24 h at 65Ōäā.
99.9% Al foil was used as the current collector in standard cells, and Al foil-64 ╬╝F modified to have withstand voltage of 3.0 Vf (modified Al foil) was used as the current collector in the test cells. Both types were made to 2.7 V with 360F EDLC cells.
2.6. Constant voltage load test and deterioration of Al foil
A constant voltage load test of the EDLC cells was performed for 2500 hours at a voltage of 2.7 V and at ambient temperature of 65Ōäā using a charger & discharger System (PEBC1005 from PNE solution). The test was performed with five EDLCs, each with standard and test cells. The test of a given cell was terminated when the case opened due to internal overpressure, and the constant voltage load test was continued until the case opened in every cells.
The surface change of the Al foil according to the constant voltage load test time was observed with a 3D measuring microscope (OLS4000 from Olympus) in two and three dimensions.
3. Results and Discussion
3.1. Cyclic voltammetry
CVs of Al foils of various purities were measured in a 1 M TEABF4/ACN electrolyte solution. The current-potential curves of the Al foils according to purity are shown in Fig. 2.
The graphs show the current response of Al foils to the applied potential. As shown in the first cycle in Fig. 2, rapid increases in the anodic current of Al foils (so-called pitting potential Ep) were observed at approximately 3.5 V. In addition, when the applied potential is higher than Ep, the anodic current of Al foils varied with purity. A comparison of the current-potential curves of the Al foils within the same polarization cycle varied with Al purity. In all polarization cycles, the higher the purity of Al, the lower the anodic current appeared.
On the other hand, as shown in Fig. 2, the anodic current decreased as scan number increased. In the third cycle, the anodic current was reduced to about a quarter of that found in the first cycle. This phenomenon may be attributed to a unique property of Al: unlike other common metals, when Al begins to oxidize with electrolyte, it forms a passivation film on the surface to resist corrosion [38-42]. This means that the higher the purity of aluminum, the more stable the passivation film formed on the surface may be.
Fig.┬Ā2.
Current-Potential (l-E) curves of Al foils according to purity recorded on polarization cycle.
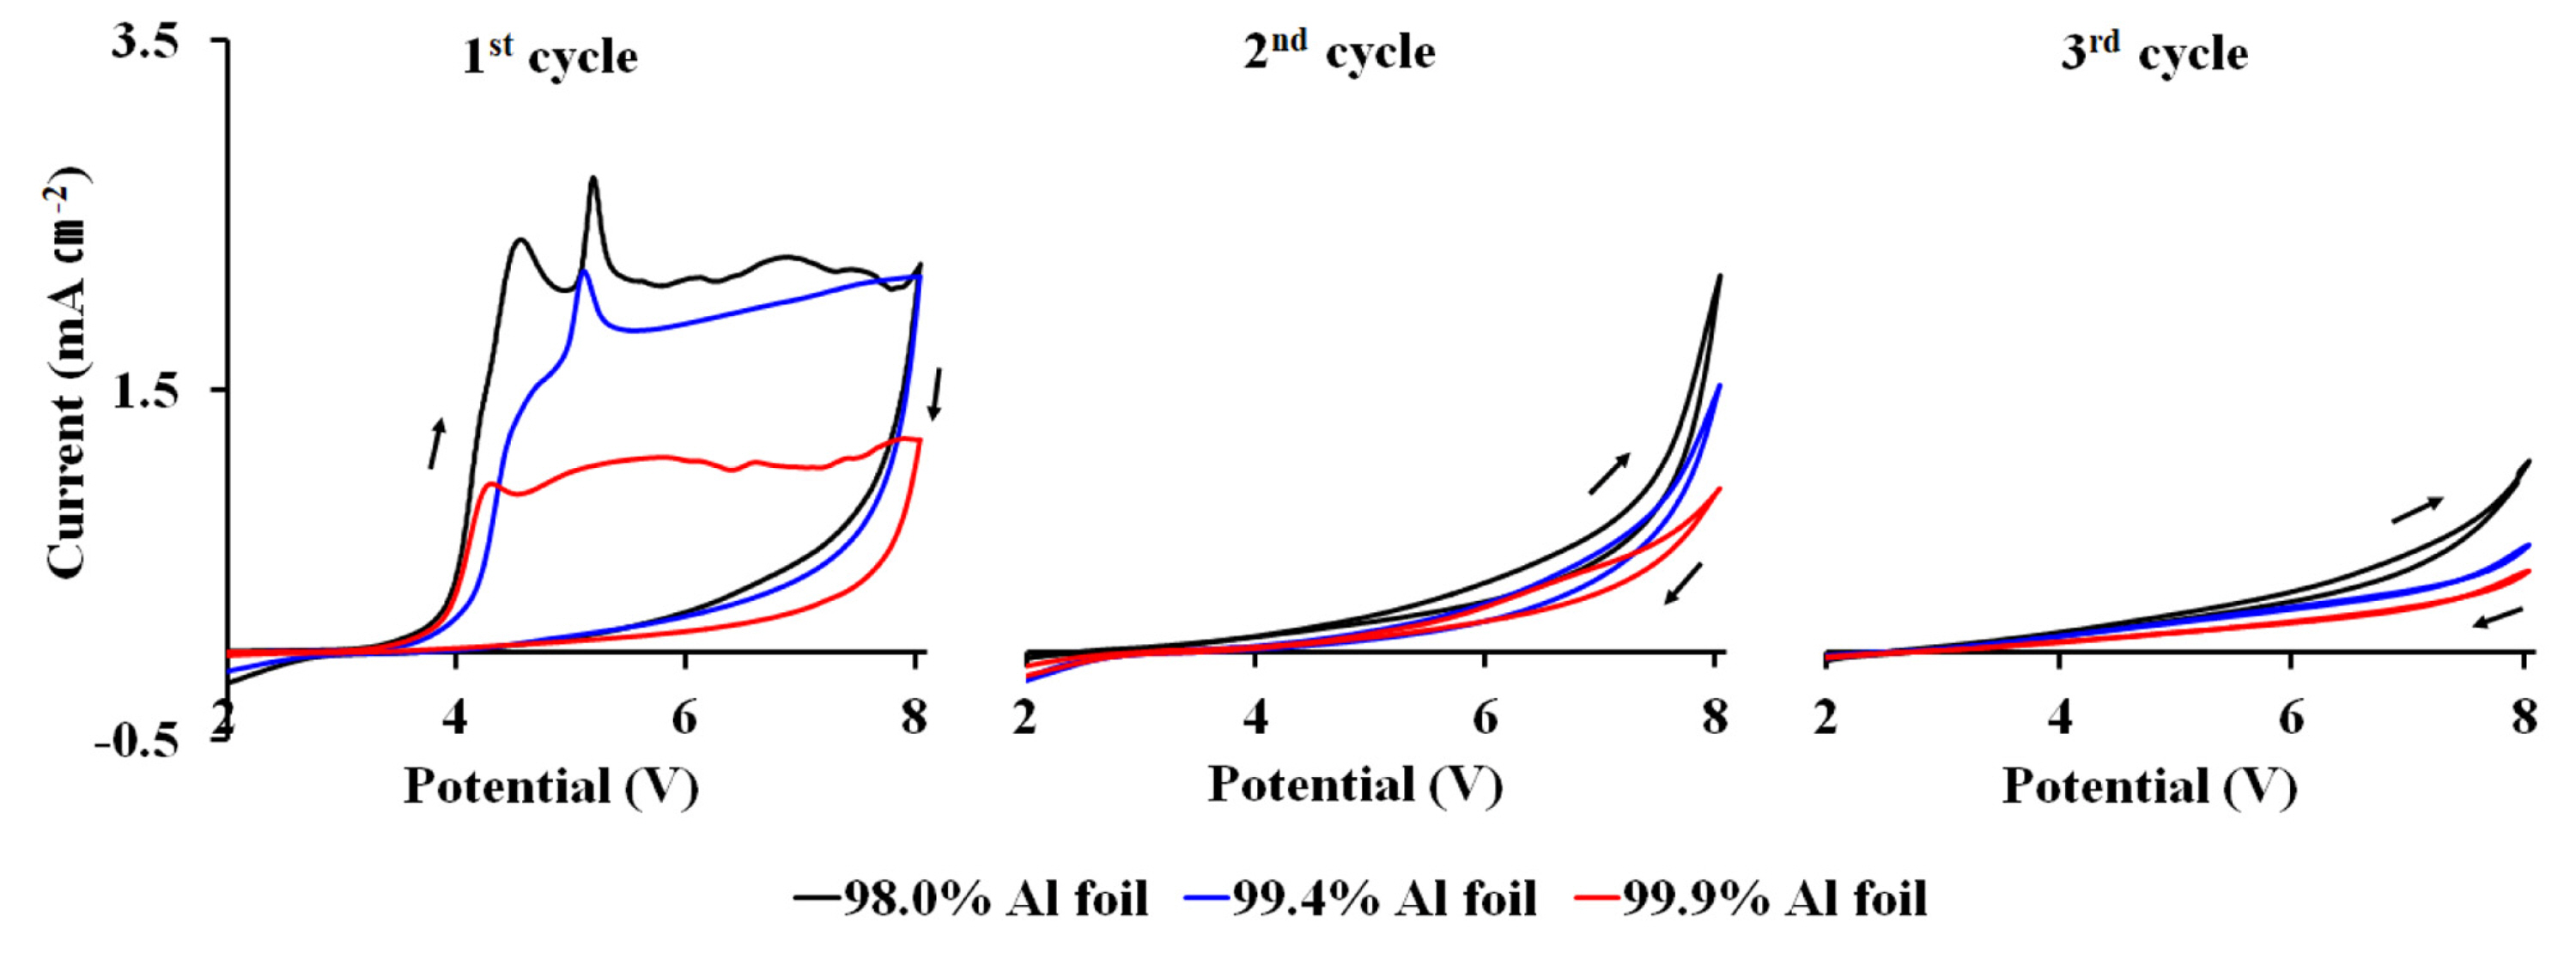
Fig. 3 (a) and (b) show the current-potential curves of Al foils with varying capacitances and withstand voltages, respectively.
Fig.┬Ā3.
(a) Current-Potential (l-E) curve of Al foils according to their capacitance, recorded on polarization cycle, (b) Current-Potential (l-E) curves of Al foils according to withstand voltage recorded on polarization.
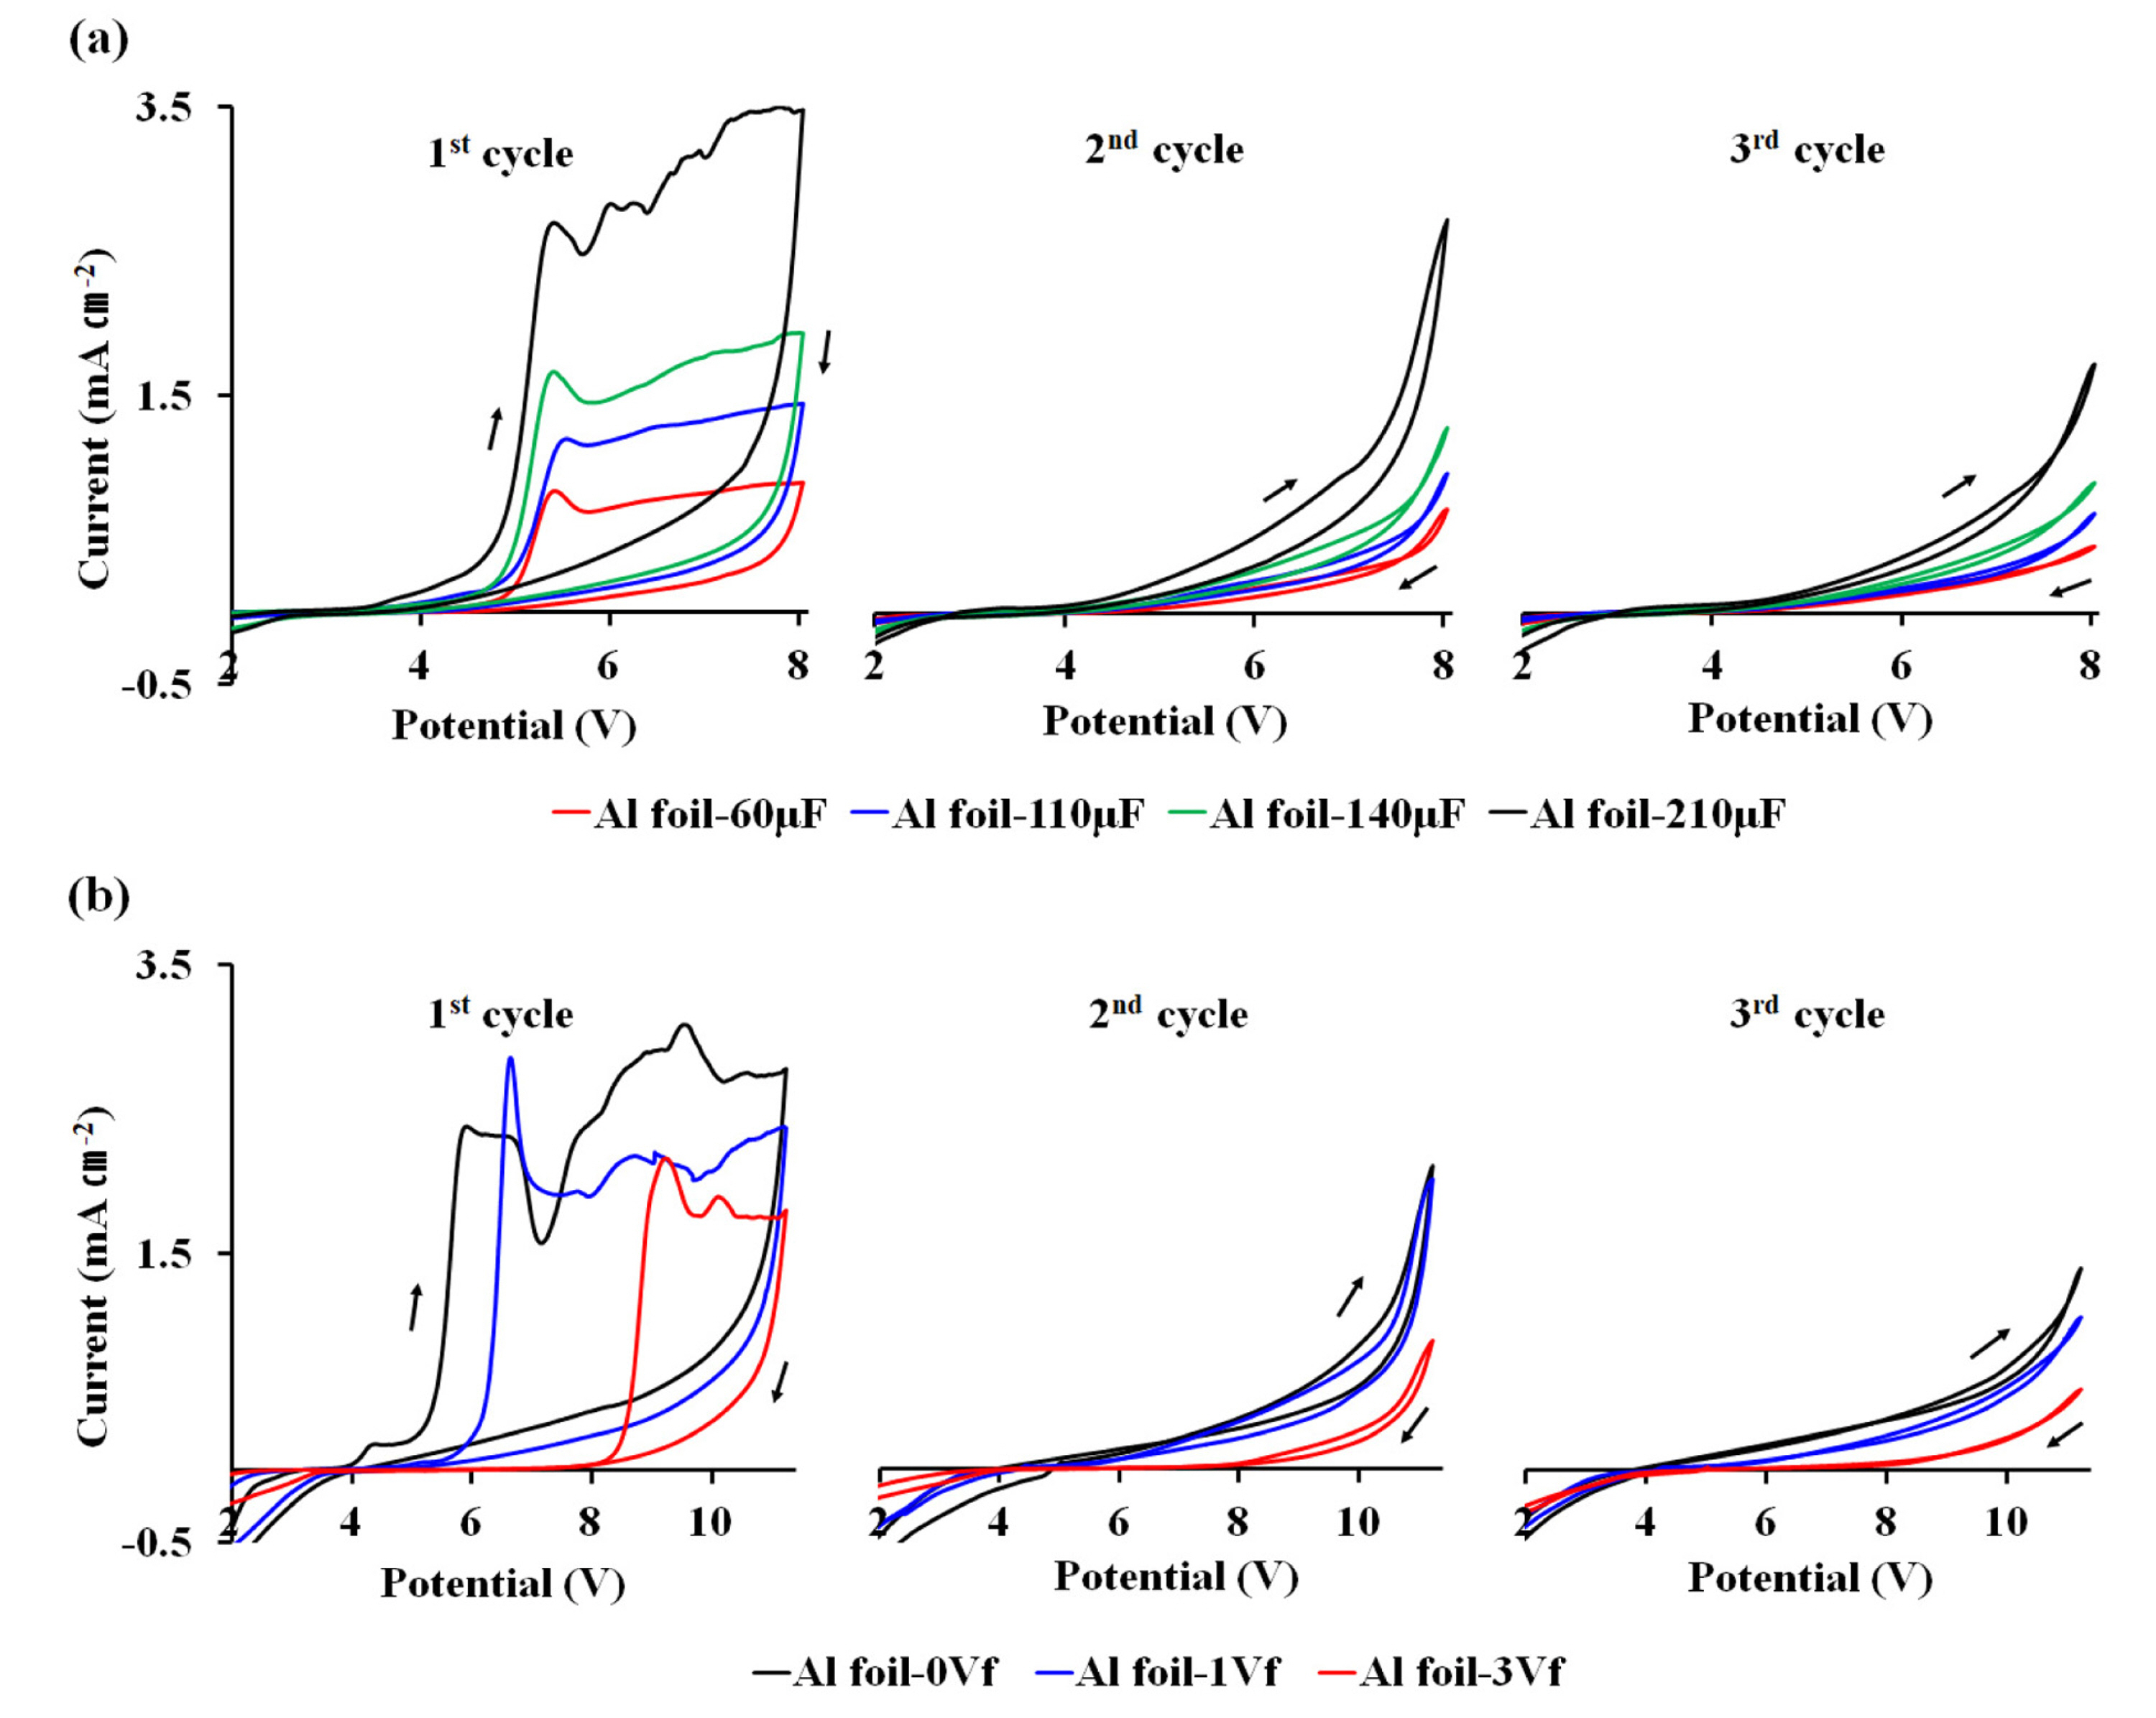
As in the current-potential curves for Al purity, the current-potential curves of Al foils within the same polarization cycle also varied according to capacitances and withstand voltages.
First, in the first polarization cycle of Fig. 3 (a), the corrosion current caused by the oxidation reaction between the electrolytic solution and the Al foil started to increase from about 4 V vs. Li/Li+. The maximum corrosion currents of the Al foils were 0.9 mA, 1.4 mA, 1.9 mA, and 3.5 mA for Al foil-60 ╬╝m, Al foil-110 ╬╝m, Al foil-140 ╬╝m, and Al foil-210 ╬╝m, respectively. As in the other polarization cycles shown in Fig. 3 (a), the higher the capacitance of the Al foil, the higher the measured corrosion current value became.
Although the areas of all the Al foils used in the CV experiment were the same, the specific surface area of Al foils becomes larger in proportion to its capacitance because increases in capacitance correspond to increases in surface roughness. Therefore, Al foil with a large specific surface area exhibits a greater increase in corrosion current above the pitting potential because the area able to react with the electrolyte is larger.
This increase in corrosion current indicates generation of more gas which is a side product of the corrosion reaction. Accordingly, it is advantageous to lower the capacitance of the Al current collector as long as no adhesion problems occur with AC.
To investigate the anodic behavior of the Al foils with various withstand voltage in electrolyte solutions, the passivation films on the Al surface were formed differently. Withstand voltage is used to indicate the degree of formation of the passivation film on the surface which resists corrosion.
Fig. 3 (b) shows the current-potential curves of Al foils with different withstand voltages, which vary according to the degree of passivation film formed on the surface. The higher the withstand voltage, the lower the corrosion current as well as higher the pitting potential during all polarization cycles. Al foil3 Vf had a very low current over a wide voltage range.
The Tafel curve can be obtained by taking the log of the absolute value of the current measured by CV, as shown in Fig. 4.
Fig.┬Ā4
Anodic and cathodic Tafel curves according to withstand voltage after first polarization cycle.
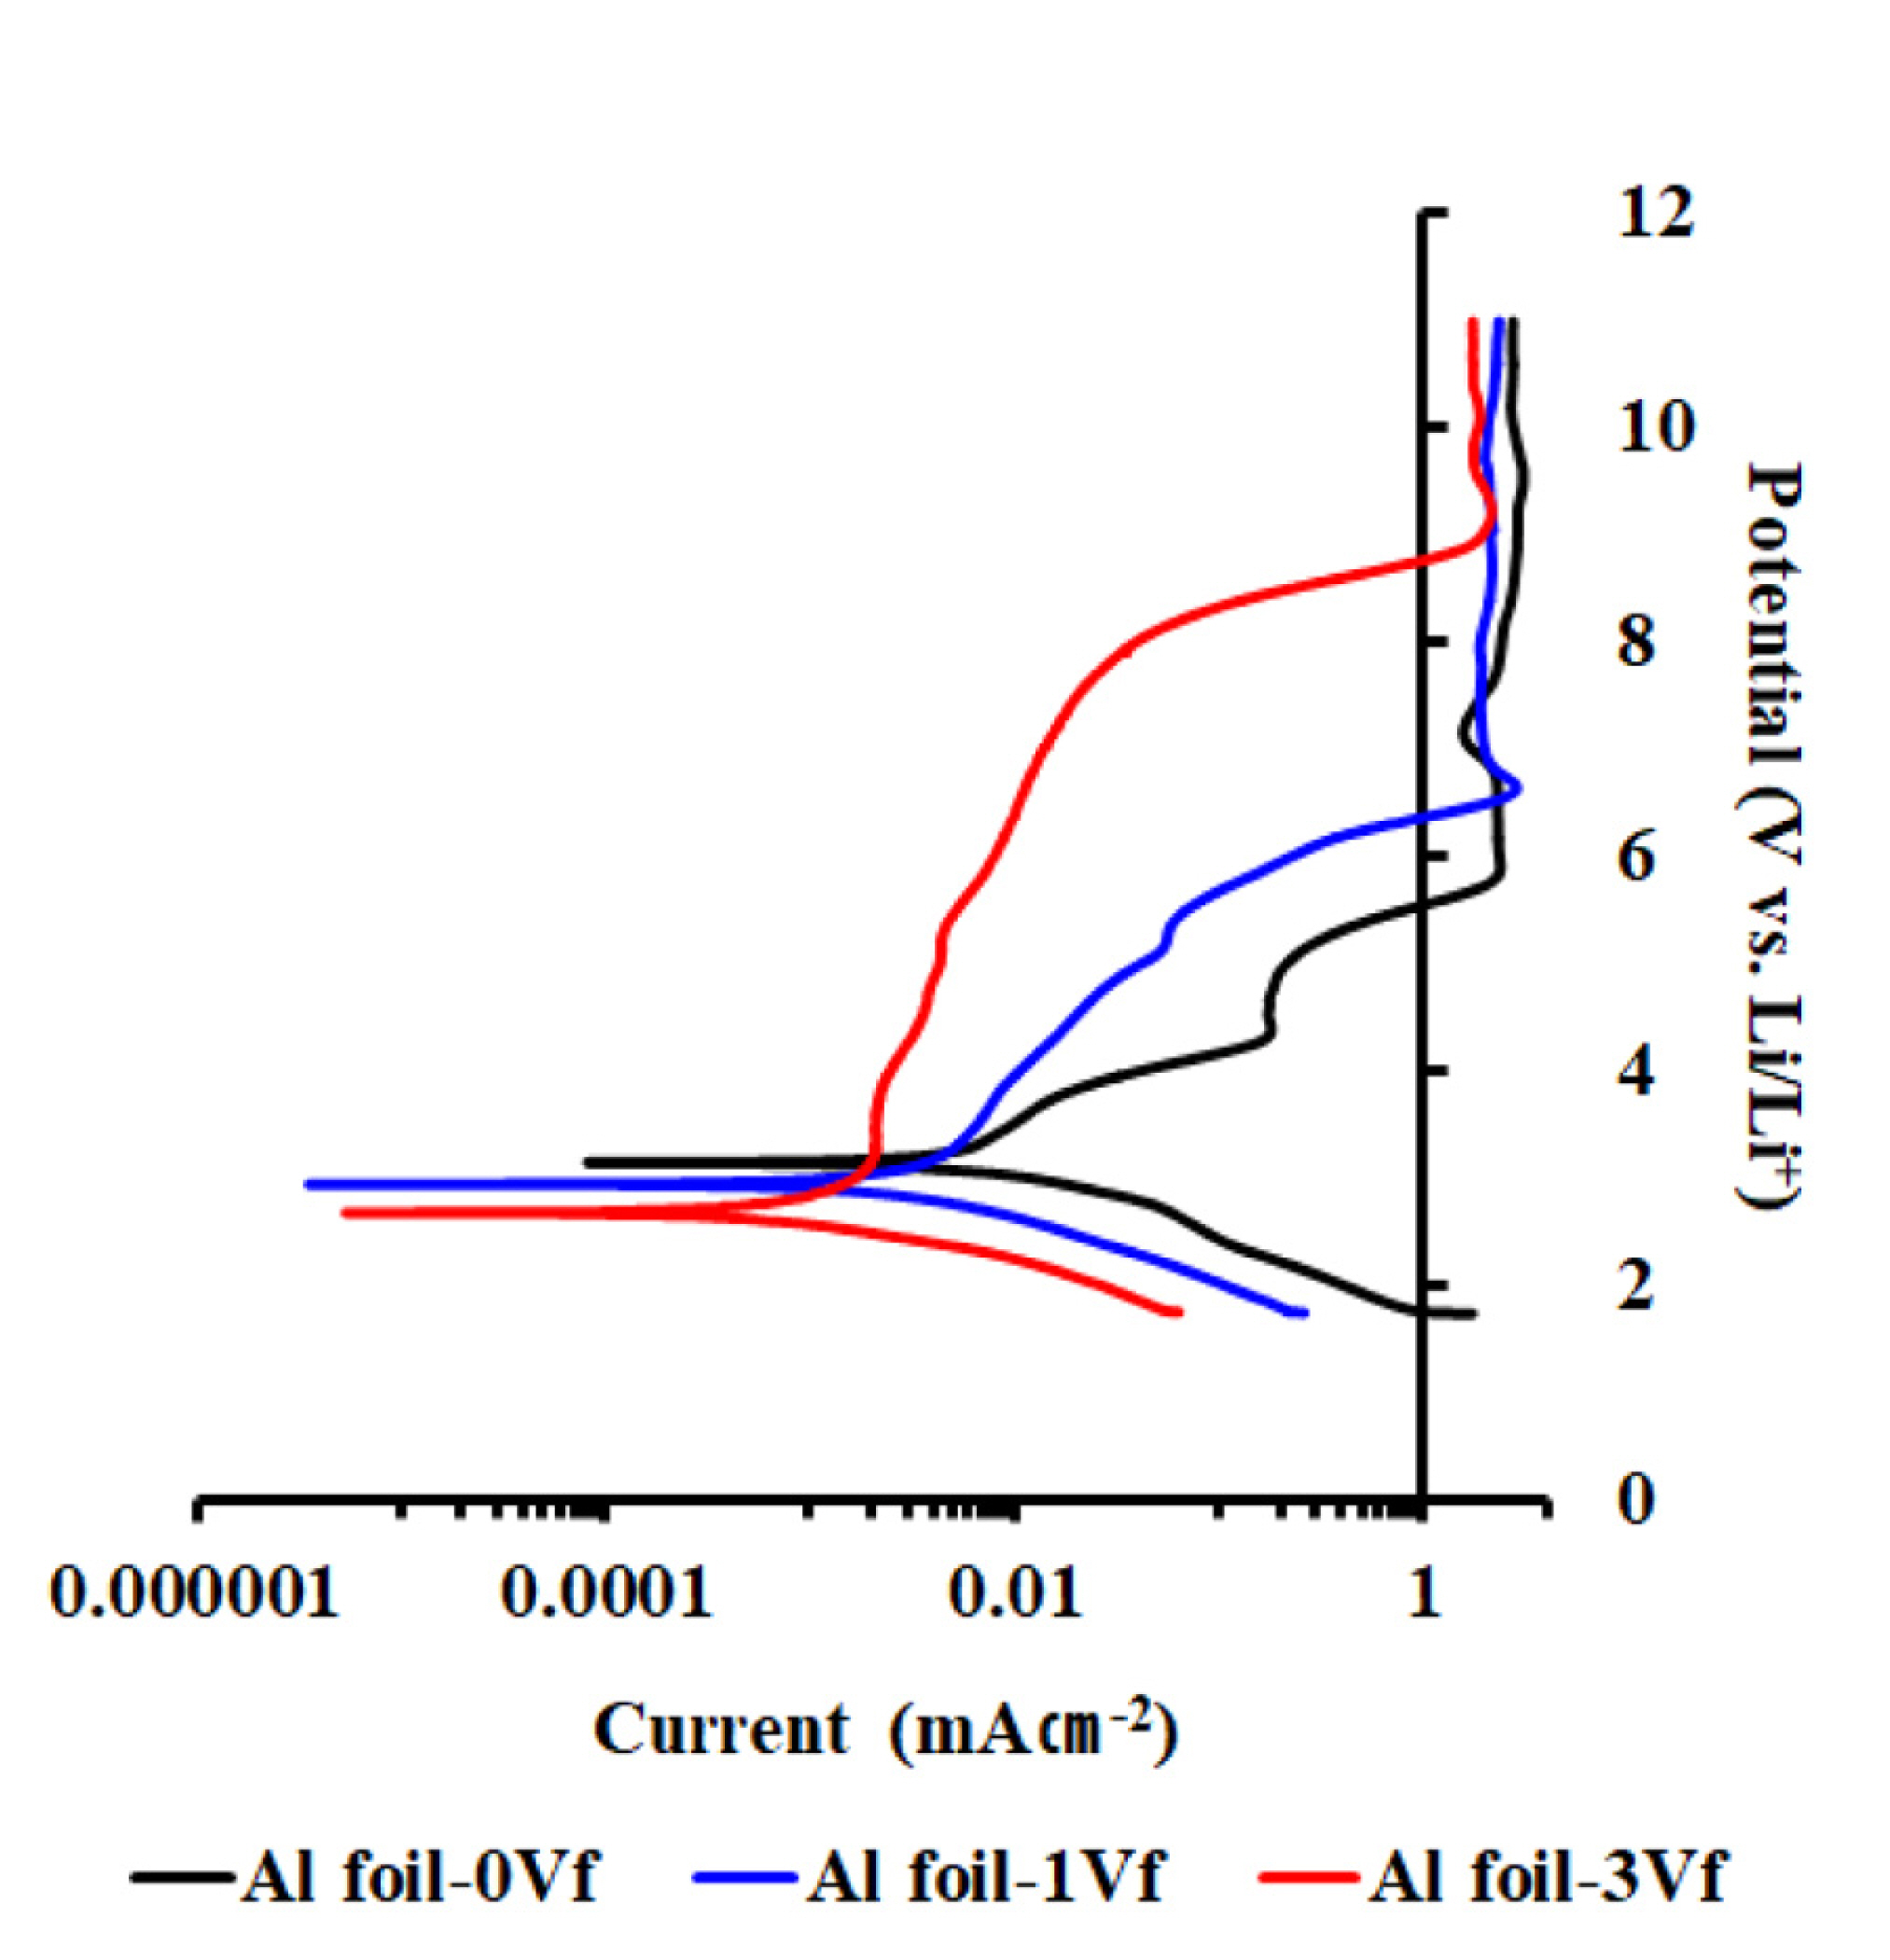
The corrosion potential (Ecorr), corrosion current (Icorr), and anodic and cathodic Tafel constants were obtained using these curves.
The polarization resistance (Rp) values were determined using the SternŌĆōGeary equation, given by Eq. (1) [43].
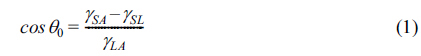
Where ΔE / ΔI is the slope of the polarization curve, which is equal to the polarization resistance (Rp).
Eq. (1) can be represented as a function of Rp as in Eq. (2).
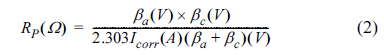
╬▓a and ╬▓c are anodic and cathodic Tafel constants, respectively. The corrosion parameters of the Al foils obtained by the Tafel curves are summarized in Table 4.
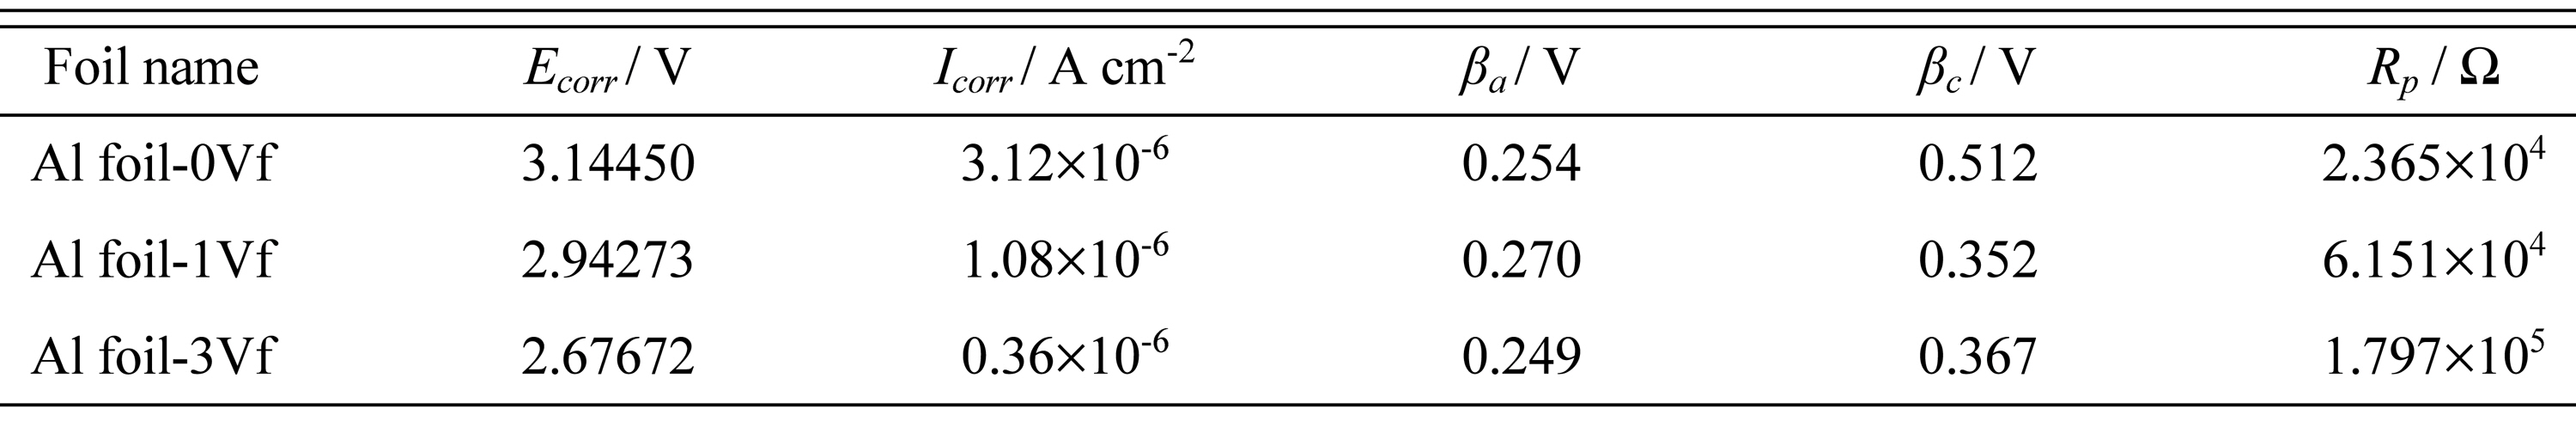
These data show that the polarization resistances of the Al foils in a 1 M TEABF4/ACN electrolyte solution varied according to withstand voltage.
The polarization resistance was highest in Al foil-3Vf and lowest in Al foil-0Vf. High polarization resistance indicates that the progress of aluminum corrosion was well suppressed. Therefore, the Al foil in which the passivation film was formed on the surface to give a withstand voltage of 3vf was the most electrochemically stable in the electrolyte.
3.2. Chronoamperometry
A CA experiment was performed to observe the currents generated by the faradaic process in Al foils of various purities and withstand voltages as a function of time.
Fig. 5 shows the CA profiles of the Al foils in a 1 M TEABF4/ACN electrolyte. As shown in Fig. 5, the currents of 99.9% Al foil, Al foil-1Vf, and Al foil-3Vf appeared to drop continuously. However, large intermittent peaks appeared and disappeared repeatedly in the current density-time plot of 98.0% and 99.4%Al foils. Continuous current oscillations are directly related to the formation and breakdown of the passivation film. The current decreased when the passivation film (which resists corrosion) is formed on the surface of the foil. However, due to the instability of the formed passivation film, it is partially destroyed over time, allowing the current to increase as anodic oxidation occurs at the location of the breakdown of the passivation film. In other words, these current oscillations are attributed to repetition of occurrence and self-healing (re-passivation) of surface defects [44-47], indicating that Al foils with a purity of 99.4% or less are electrochemically unstable in the ACN electrolyte.
Fig.┬Ā5
Chronoamperometry profiles of Al foils in 1M TEABF4/ACN electrolyte at 3.5 V; (a) Full Chronoamperometry profiles, (b) Chronoamperometry profiles under 0.4 mAcm-2 current.

The current density-time plots of 99.4% Al foil, Al foil-1Vf and Al foil-3Vf, which share a 99.4% Al purity but have different withstand voltages, have significant differences. Current oscillations disappeared with increasing withstand voltages on 99.4% Al foil, and the current density-time plot of Al foil-3Vf was similar to that of 99.9% Al foil. The electrochemical instability of 99.4% purity Al foil, which was unstable in the ACN electrolyte, was improved by increasing the withstand voltage by forming a stable passivation film on the surface purity.
Conclusively, the destruction-reformation of the passivation film on the surface of the low purity and/or low withstand voltage Al foils are repeatedly caused by the electrolyte solution, while corrosion is inhibited in the Al foils with high withstand voltages and/or high purity due to the formation of passivation films with high resistances to corrosion.
3.3. Constant voltage load test in high temperature
A constant voltage load test was carried out to test the reliability and safety of the cells using the modified Al foil. One of the cell types used for the load test was a standard cell with a 99.9% purity commercial etched Al current collector with a capacitance of 110 ╬╝F/cm2. The other type was test cells made with the modified Al foil.
Fig. 6 shows the capacitance and ESR with their time-dependent variation during the constant voltage load test of EDLC cells at high temperature.
Fig.┬Ā6.
Characteristics change as a function of time at a constant temperature 65Ōäā and constant voltage of 2.7 V: (a) capacitance retention, (b) ESR, (c) capacitance variation and (d) ESR variation.

The initial capacitance and initial ESR of the standard cells were 398.25 F and 3.34 m╬®, respectively, while the initial capacitances and ESR of the test cells were 401.69 F and 3.57 m╬®, respectively. A capacitance decrease and ESR increase were observed in all cells over a 1,500 hour aging process at constant temperature of 65Ōäā and constant DC voltage of 2.7 V. As a result, their capacitance and ESR were 312.52 F, 4.96 m╬® (standard cells), and 314.54 F, 5.08 m╬® (test cells), respectively. Capacitance and ESR variations were estimated as 21.53% and 48.69% for standard cells and 21.02% and 42.27% for test cells. After aging, differences were observed in the characteristics of the standard and the test cells groups.
The ESR variation of the standard cells was higher than that of the test cells. Due to the corrosion of the Al foil, the adhesion between the AC coating layer and the Al foil weakened, resulting in partial delamination of the AC coating layer. This delamination, in turn, leads to an increase in contact resistance [37,48].
The cell cases did not open before 1500 hours, but each of the five standard cells failed before 2000 hours, interrupting the constant voltage test. The cell case opening may be the result of gas evolution caused by the corrosion reaction of the Al foil and the redox reaction between the activated carbon and the electrolyte [35, 49-52]. Corrosion of Al foil is caused by HF produced by the redox reaction with the electrolyte [35,37,42,53-56]. The overall reaction equation for the corrosion of Al foil is shown in Equations (3) and (4).


It is well known that protic acids generate hydrogen gas during the corrosion reaction with aluminum, as shown in Eq. (4) [57-60].
Notably, some researchers have found that hydrogen gas is the most detected element in the analysis of the gas generated in the EDLC cell [61]. Because the Al foil corrosion resulted in a pit depth of 5 ╬╝m (measured in Section 3.4 of this study), it can be inferred that the dissolution of the aluminum oxide layer, which is formed on the Al foil surface to a thickness of up to 4 nm, takes place earlier in the corrosion reaction in equation (3). Thereafter, dissolution of Al and hydrogen gas evolution, as in equation (4), are considered the dominant reactions. Further study is necessary to understand the details of the gas evolution process during the corrosion reaction of Al foil in EDLC.
Meanwhile, none of the test cells failed in up to 2000 hours of constant voltage testing. The capacitance and ESR of the aged cell were 304.04 F and 5.59 m╬®, respectively. The capacitance and ESR variation were 23.66% and 56.70%, respectively. Eventually, the constant voltage load test was interrupted due to the failure of all five test cells before 2500 hours. Through this experiment, it was confirmed that the reliability and safety of EDLC improved when the modified foil was used as the current collector.
3.4. Aging of Al foil in EDLC
To understand the deterioration process of the Al current collector, the standard cells under the constant voltage load test were dissembled every 500 hours. At this time, the surface change of the Al foil after removal of the AC coating layer on the electrode was measured with a 3D microscope in two and three dimensions.
Fig. 7 shows the surface of the Al foil before and after the constant voltage load test at 500, 1000, and 1500 hours, respectively.
As shown in Fig. 7, the corrosion of the Al foil progressed with time, and after 1000 hours, wide and deep corrosion pits were observed. Before the constant voltage load test, corrosion pits measured about 2~3 ╬╝m in width and 0.5 ╬╝m in depth. After 1000 hours, the width and depth were about 9 and 1.3 ╬╝m, respectively, reaching a maximum of 16 ╬╝m and 3 ╬╝m, respectively, at 1500 hours.
Fig.┬Ā7.
Al foil surface during the constant voltage load test at different times (├Ś 2774): (a) before the test, (b) after 500 hours, (c) after 1,000 hours, and (d) after 1,500 hours.

Especially in the case of the cell which failed at 1500 hours, the AC coating layer on the outer portion of the electrode peeled with light contact and white Al foil appeared as shown in Fig. 8 (a) and ŌæĀ .
Fig.┬Ā8.
(a) Element of the cell with case opening (b) Al foil surface at the ŌæĀ location (├Ś2774).
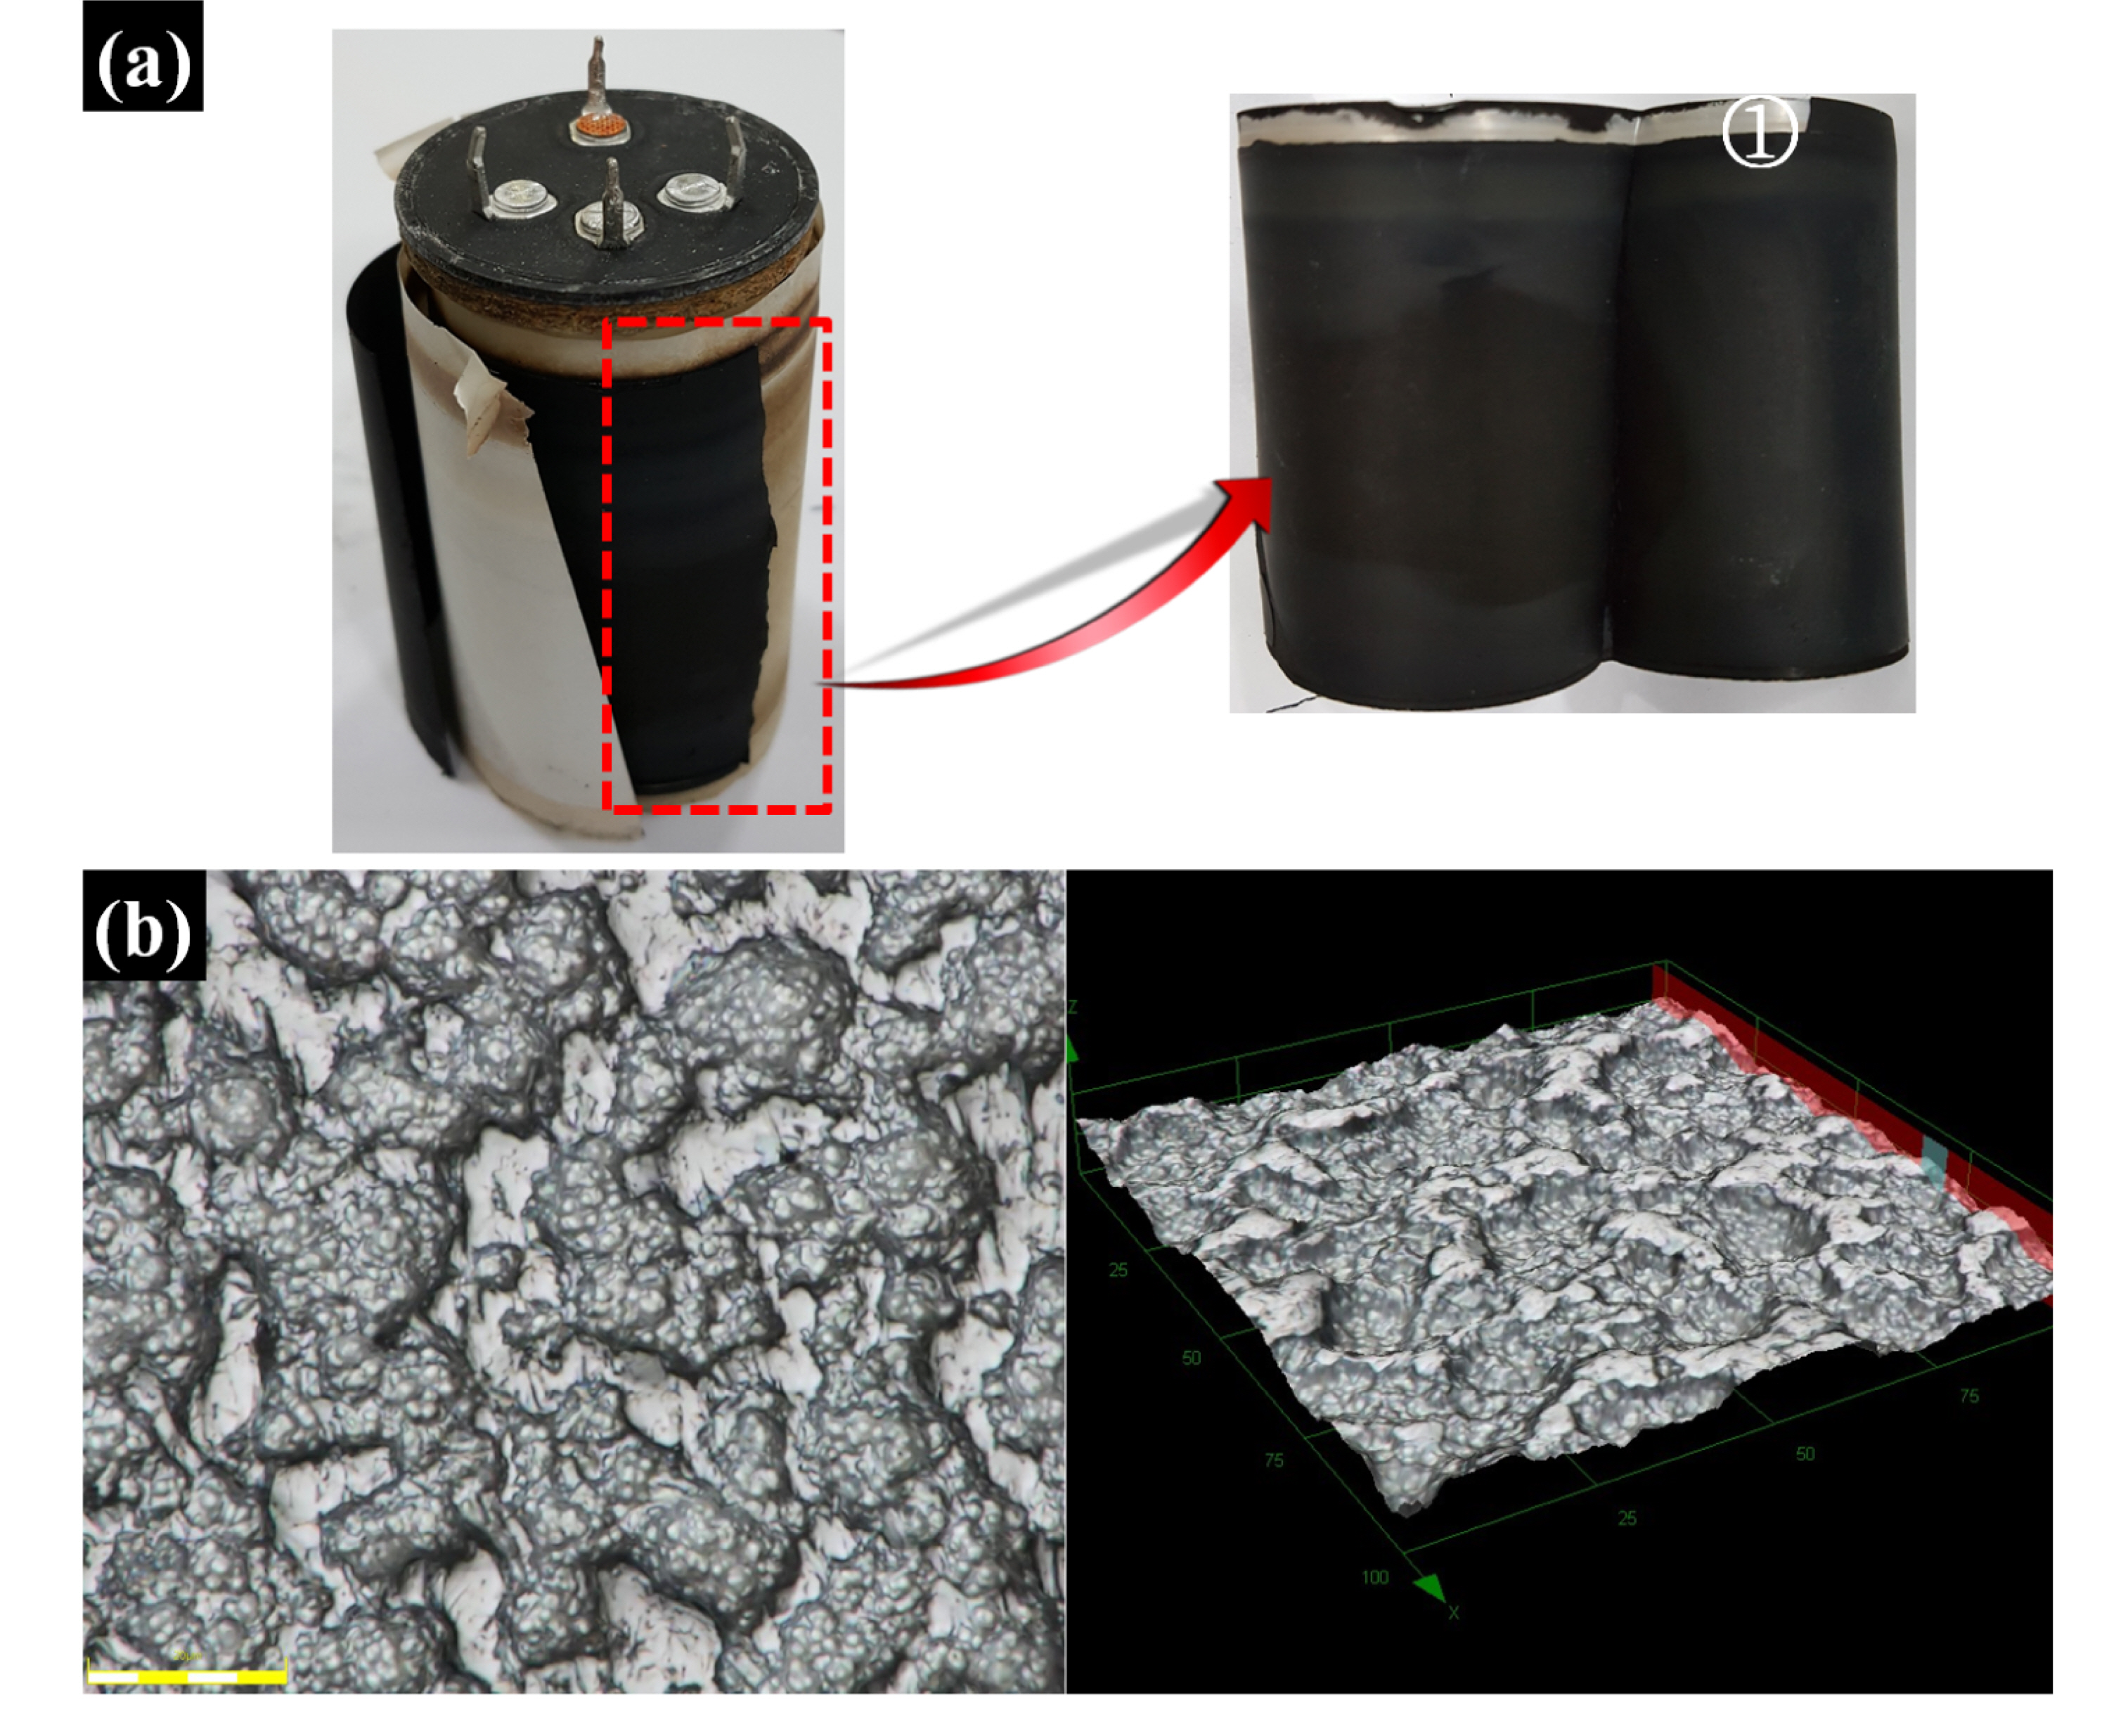
Very severe corrosion was observed in the Al foil at this position, which is shown in Fig. 8 (b). The AC coating layer could no longer be bonded, and the corrosion pits measured up to 52 ┬Ąm in width and 5 ┬Ąm in depth.
4. Conclusions
We present our investigation of the anodic behavior of various types of Al foils in EDLC electrolyte solutions. The experiment results of CV and CA showed that the electrochemical stability of the Al foils were influenced by its purity, capacitance, and withstand voltage. Al foils had greater electrochemical stability when they were of higher purity, lower capacitance, and higher withstand voltage. In particular, as the withstand voltage rose, the pitting potential and the polarization resistance increased significantly.
Based on these results, a modified Al foil with a more stable passivation film on the surface was made by lowering the capacitance and conducting a forming process. Then, constant voltage load tests of standard cells using an conventional current collector (99.9% Al foil) and test cells using a current collector with the modified Al foil were performed at high temperature. During the constant voltage load test, failure (indicated by opening of all cell cases) occurred after 1500 hours in standard cells, while test cells operated normally up to 2500 hours. This confirmed that the reliability and stability of the EDLC cell were improved by using the modified Al foil as the current collector. In addition, the electrochemical stability of the low-purity Al foil was effectively improved, which may reduce the manufacturing cost of the EDLC.
Additionally, to understand the deterioration process of the Al current collector, the corrosion progression of the Al foil was observed using a constant voltage load test. The adhesion between the AC coating layer and the Al foil was weakened due to the corrosion of the Al foil, causing partial delamination of the AC coating.


