1. Introduction
The low cost and high energy density of Zn make Zn-air batteries attractive energy storage devices [1]. Zn air batteries have already been commercialized as a primary cell that is used in hearing aids [2]. The anode technology of Zn and electrolytes originates from the alkaline primary cells [3]. The high energy density of Zn can render these batteries more cost-effective if they are rechargeable. In order to successfully produce a secondary battery, the properties of the components in the battery should be improved, with the aim of extending the cycle life. Water depletion is among one of the various factors hindering the improvement in the cycle life of ZnŌĆōair batteries. Water depletion is directly related to the life of the battery [4,5]. As the solvent (water) gradually decreases in the cell, the resistance of cell operation increases, causing the battery to be inoperable at the end. Polyacrylic acid and its counter anions are super absorbent polymers [6,7] that are used to hold water as a gelling agent for the battery [8ŌĆō10]. Although the gelling agent prevents water from rapid evaporation, adding a gelling agent to the solution increases the resistance of the battery, which consequently affects its cycle life. Electrolysis of water is one of the electrochemical reactions competing with the battery charging process, because H2 evolution and reduction of Zn2+ occur simultaneously at a certain potential [1,5,11]. Therefore, understanding the electrolysis in the battery is important to improve its cycle life. The following reactions (Equations 1 and 2) are the water splitting reactions in a basic solution at the electrodes of the ZnŌĆōair batteries:
Equation 1 and Equation 3 represent the charge process at the cathode of the batteries. The following reactions are charge processes at both the electrodes:
Zn2+ ions convert to Zn(OH)42ŌłÆ (zincate) in the basic solution and subsequently convert to ZnO [12ŌĆō14]. The formation of ZnO and related reactions are not discussed in this work. Other routes for water consumption are evaporation of water [15,16] and corrosion of Zn [17ŌĆō19]. In rechargeable cells, the air holes are kept open for cell operation, thereby allowing continuous evaporation throughout the battery life. Equation 6 represents the corrosion reaction, in which water is spontaneously consumed to produce H2. Once H2 is evolved through the reactions in Equations 2 and 6, the consumed water is not restored, because H2 diffuses away from the electrode.
In order to overcome the problems faced with aqueous electrolytes owing to water consumption, new approaches based on non-aqueous media, such as polymer gel electrolytes [20ŌĆō22], ionic liquids [23,24] and molten salts [25] have been established. However, these new electrolytes are at early stages of studies, and the aqueous electrolytes still have many advantages regardless of their drawbacks. The aim of this work is to understand the reactions related to water consumption in basic electrolytes in Zn-air batteries. We categorize the water consumption into two paths, namely, electrolysis [26ŌĆō28] and other reactions (evaporation and corrosion combined). Electrolysis is the active path and shares the same reaction as the charge process of the battery. The other reactions take the passive path, which is spontaneous and unavoidable. The contribution of each path to water consumption will be analyzed. Also, the dependence of water (moisture) and oxygen on the cell voltage is studied, because these are the reactants in the reactions. The concentrations of these reactants vary when the weather changes.
2. Experimental
Zn foil (0.1 mm thick, 99.994%, Alfa Aesar), KOH (Junsei Chemicals, 85.0%), zinc sulfate monohydrate (Sigma-Aldrich, 99.0%), and poly(acrylic acid) (PAA, Sigma-Aldrich, Mw ~ 1,250,000) were used as received. An aqueous solution of 4.0 M KOH is used as the electrolyte.
Linear sweep voltammetry (LSV) was performed in order to observe the electrolysis of water on Zn and air-cathode. Zinc foil (0.503 cm2, 0.1 mm thickness, 99.994%, Alfa Aesar) was polished with a polishing cloth and rinsed with deionized (DI) water before use. One side of the foil was exposed to the electrolytes for the measurement. A Hg/HgO electrode (1.0 M KOH solution, CHI102, CH Instruments, Inc.) was used as the reference electrode, while Pt wire was used as the counter electrode. Prior to LSV measurements, the solutions were given a rest time of 5 min. The scan was started at the open circuit potential (OCP, ca ŌłÆ1.43 V) at a rate of 5 mV sŌłÆ1 using a potentiostat (BioLogic Science Instruments, model SP-150). In order to minimize the corrosion of Zn, the scan was started as soon as the set-up was ready. LSV on the cathode (ADE 75, MEET) was started at the OCP (ca ŌłÆ0.01 V) at a rate of 5 mV sŌłÆ1. The cathode was composed of Co3O4, carbon black, and polytetrafluoroethylene at a weight ratio of 10:50:40. For LSV on cathodes, the rest time before the scan was 30 min. Wetting time is necessary for the cathode. The cells for LSV are shown in Figs. S1 and S2 (Supporting Information). The cell for the air cathode had holes at the bottom block for air intake. The assembled cell was held 10 cm from the table to secure the air flow.
Battery tests (full cell) were performed with the cell schematically illustrated in Fig. S3. The cell data were obtained with a battery cycler (WonATech Co., model WBCS3000). An air cathode (ADE 75, 22 ├Ś 22 mm) and a Zn mesh anode were used. A polypropylene separator (3501, Celgard LLC) was placed in between the two electrodes. The Zn mesh was prepared by plating on the Pt mesh (20 mm ├Ś 20 mm, 50 mesh) at a current of 80 mA for 2 h in 1.0 M ZnSO4 solution. The plated Zn electrode was rinsed with DI water and dried before use. Electrolytes (2 mL) were added to the anode compartment before the measurements. The cells were allowed to rest for 1 h before the full cell tests and were operated at 20 mA cmŌłÆ2 during the 2 min charge and discharge cycles, which was equivalent to 1% depth of discharge (DOD). Every charge and discharge cycle had a rest time of 20 s.
The mass loss of the battery was recorded at each given time during the battery cycle tests. The cell was stopped at the given time interval, and the mass of the cell was obtained. The observed mass change was a manifestation of the losses by both the active and passive paths. Another cell was prepared to obtain the mass change by the passive path (corrosion and evaporation) alone. It was necessary to maintain the same mass for all the cells. The mass of the cell during the cycle was obtained at 0, 1, 2, 3, 4, 5, 10, and 24 h. In order to obtain the mass at a given time, the cells were disconnected from the cycler, and then reconnected to the run cycles again till the next measurement time was reached. Mass changes from both the active and passive paths occur during the cell cycle. The measurement of passive path is identical to that of the cell cycles, but the cycler is not used. From these comparative experiments, we could determine the individual contribution of each path on the water consumption.
3. Results and Discussion
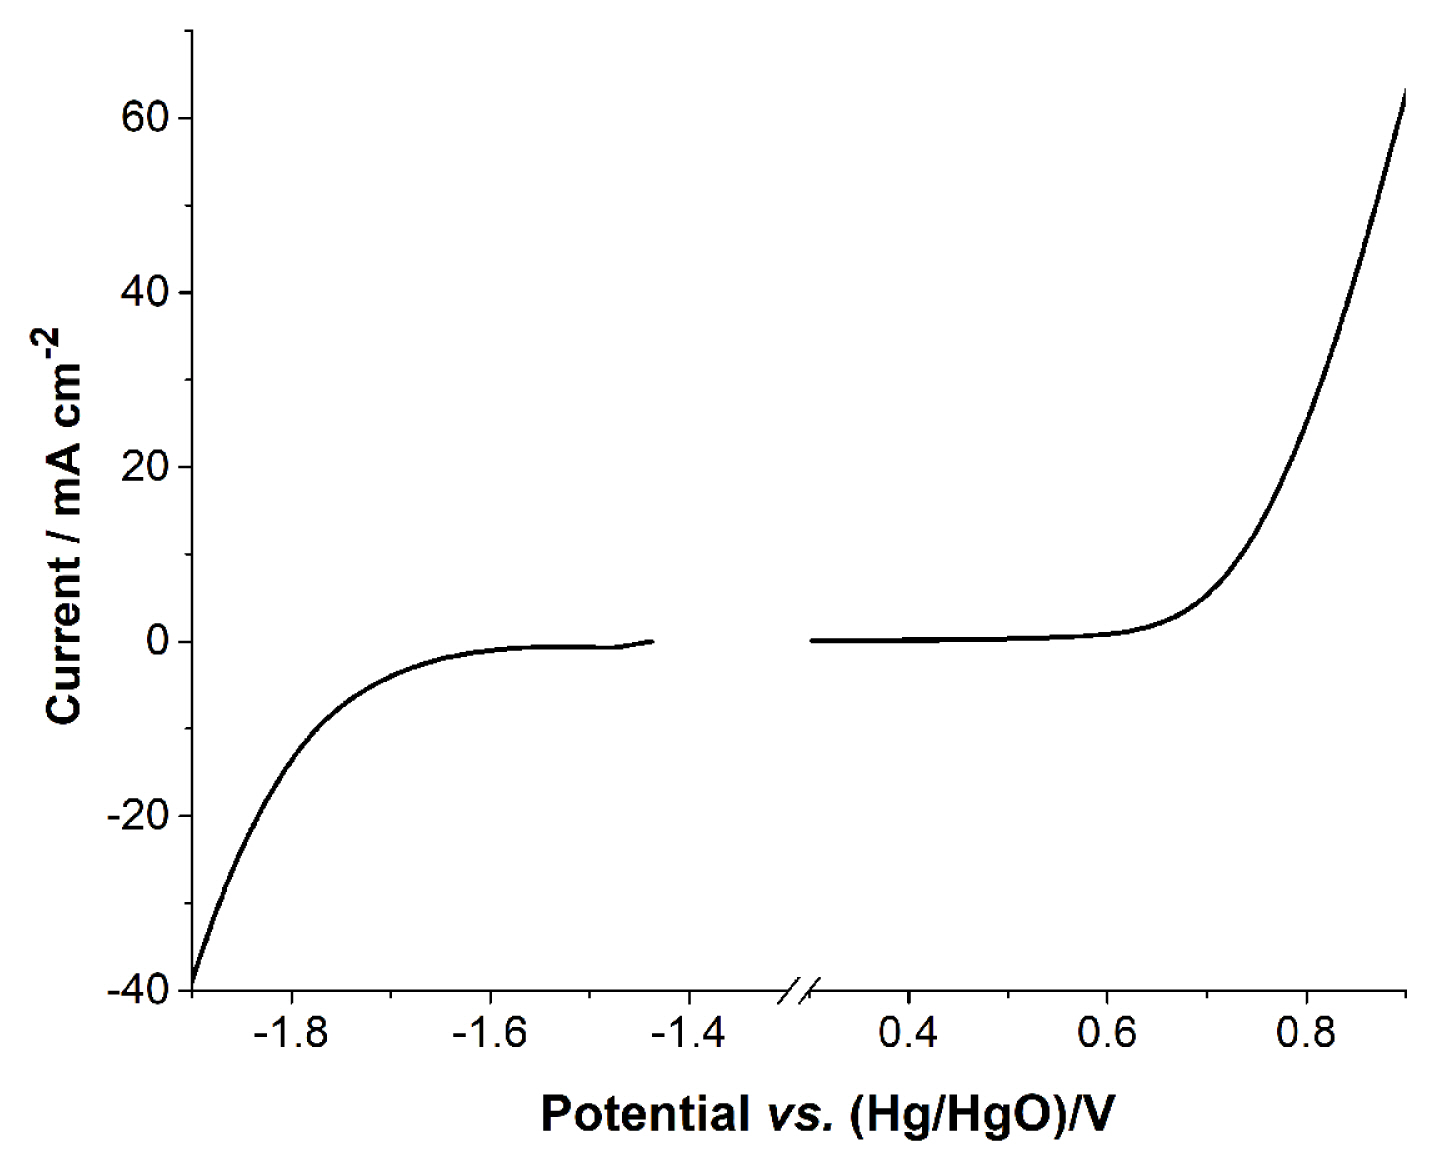
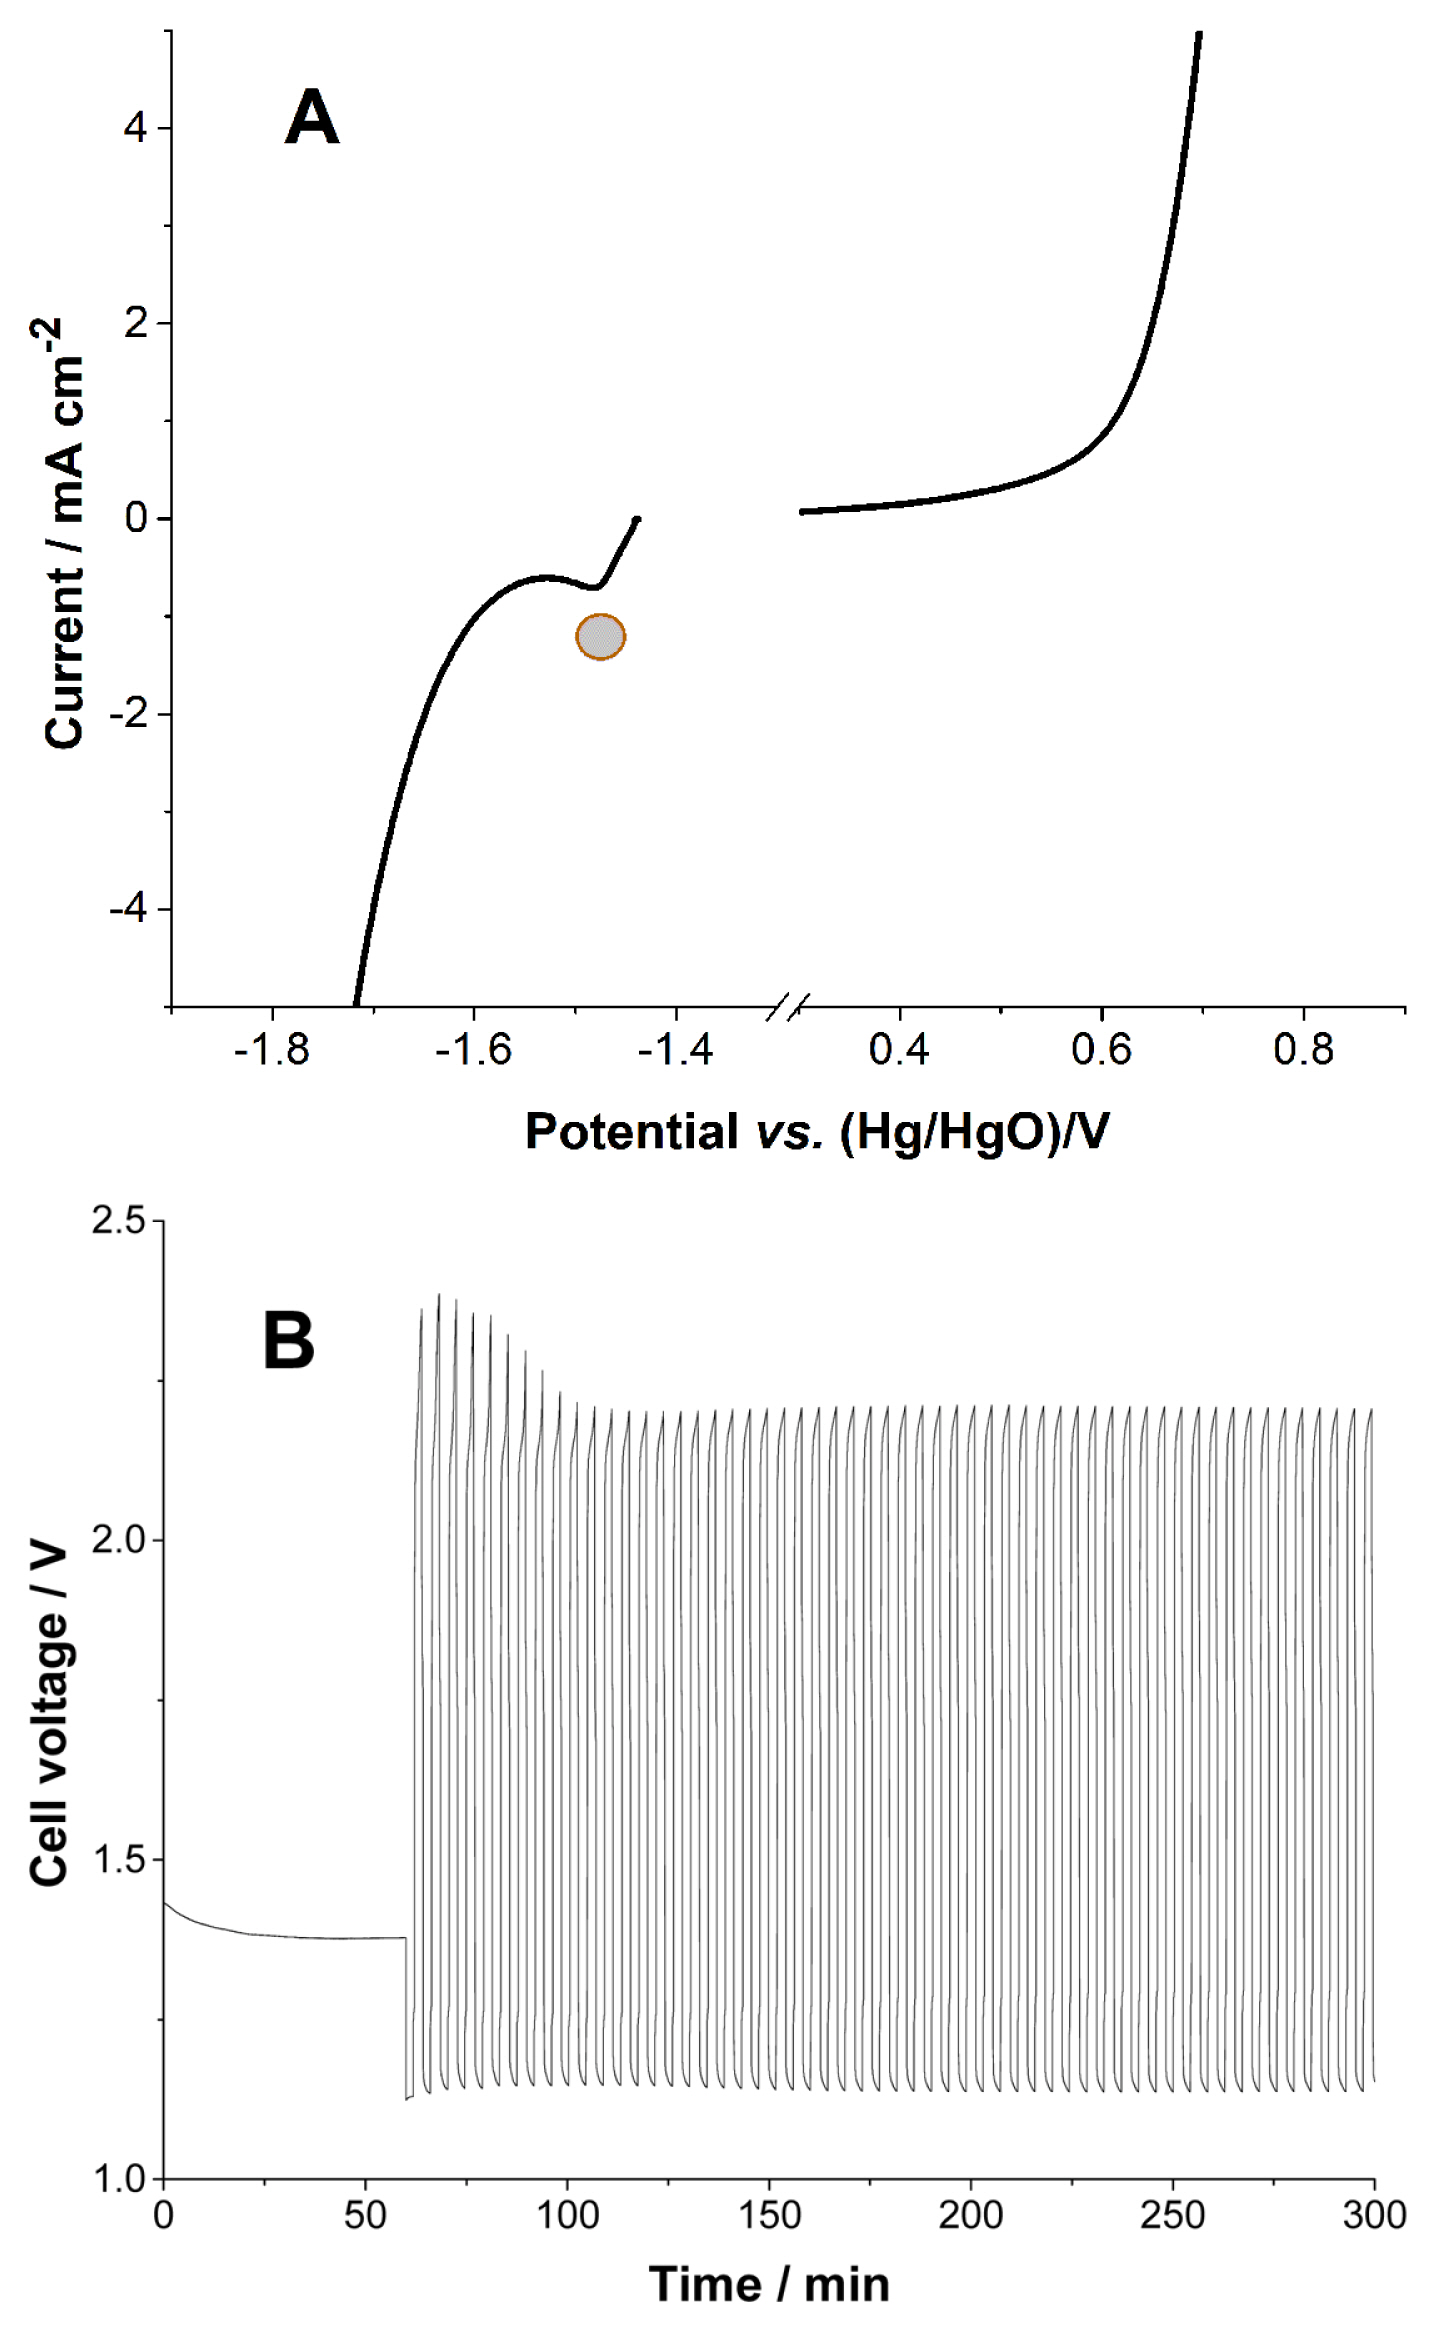
The electrochemical potential window of 4.0 M KOH solution is shown in Fig. 1. The potential window was obtained using a Zn foil and air cathode as the anode and the cathode in the full cell. The electrolytic reaction at the negative end represents the hydrogen evolution reaction (Equation 2), which is similar to the reduction potential of Zn2+ (Equation 4). The positive end undergoes the oxidation reaction for the air cathode (Equation 3) and also participates (Equation 1) in the hydrogen evolution reaction. When a full cell is operated, the current at the positive end is divided into cell operation (Equation 3) and electrolysis (Equation 1). Fig. 1 shows the potential window of the electrolyte, in which reactions with small current are not identified. The enlarged curve in Fig. 1 gives detailed information on the reactions at the electrodes.
LSV of the negative potential scan was obtained with Zn foil. It is necessary to obtain the curve quickly, otherwise Zn2+ ions from the corrosion of Zn would create a large reduction current within the potential window. However, there is always some reduction current from Zn2+, because the corrosion starts immediately after the metal comes in contacts with the KOH solution. The encircled peak in Fig. 2A corresponds to the reduction peak of Zn2+. Although the reduction peak originates from the corrosion of Zn metal, the peak appears at a reduction potential that is identical to reduction peak potential of the anode in the ZnŌĆōair battery. Rapid H2 evolution occurs right after Zn2+ reduction. Two reduction reactions overlap at 1.5 V. Fig. 2B shows the cell voltage of the full cell cycles, with the cell requiring at least 2.2 V for the charge reaction. This means that hydrogen evolution is unavoidable in this electrolyte, because the width of the potential window is less than 2.2 V. Also, the overlapping Zn2+ reduction and hydrogen evolution reaction lead to the consumption of water during the charge process.
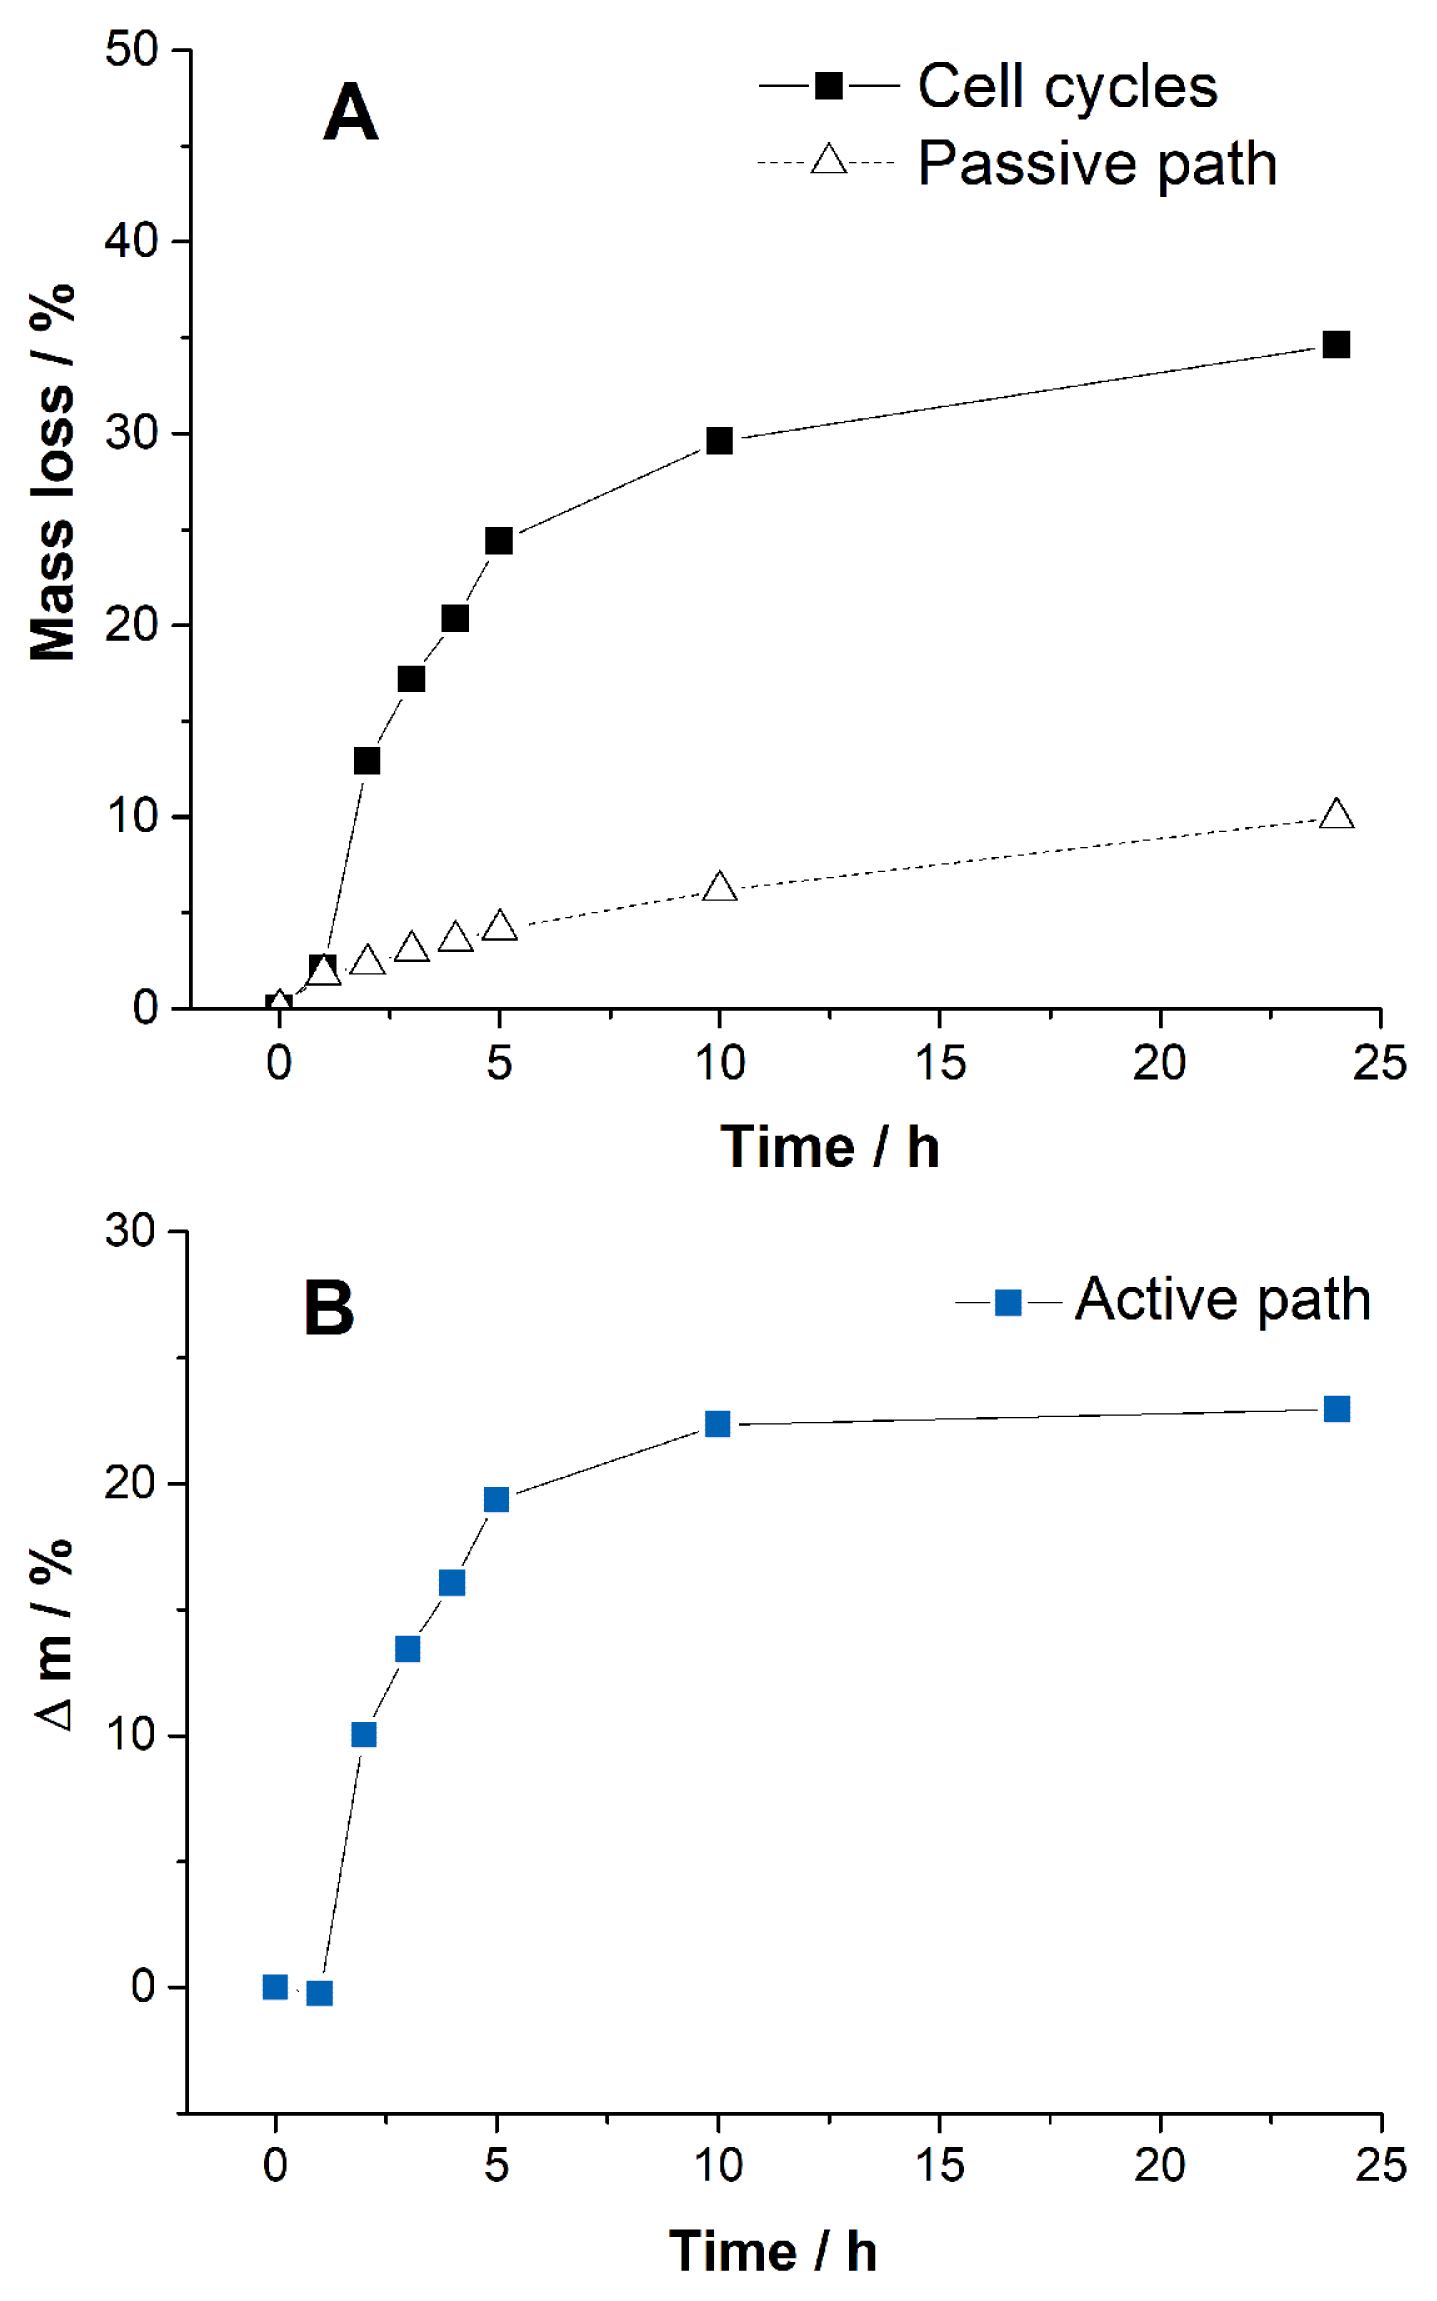
The contribution of water consumption by each path is obtained by measuring the change in mass of the cells during the cell operations. We considered that the mass loss originated only from the water consumption by the cell. The reaction of CO2 with KOH to form carbonates should result in an increase in the mass. However, mass gain is not considered in this work, because it is much smaller than the mass loss. When the cells are cycled, the recorded mass loss includes contributions from both the active and passive paths (Fig. 3A). Therefore, the mass loss by the active path (Fig. 3B, the electrolysis) is obtained from the difference in mass loss between the cell cycles and passive path. Both evaporation and corrosion can be influenced by electrolysis. However, we shall not discuss the influence of electrolysis on corrosion and evaporation in this work. Clearly, water consumption by the active path is much rapid than that by the passive path throughout the time. Most mass loss occurs in 5 h in the active path. The mass change by the active path slows after 10 h of the cycle, as shown in Fig. 3B. The passive path is constant over time, becoming the main mass loss path after 10 h. At 24 h of cell operation, 22.9% electrolyte was lost through the active path. In contrast, only 11.7% was lost through the passive path. The passive path contributes to one-third of the electrolyte consumption for the cell operation. Loss of water during the cycles at 24 h is 34.6% (Fig. 3A), which increases gradually till the end of battery life. The cell voltages remain stable till the water is nearly exhausted, as shown in Fig. S4, and then the cells cease to operate because of the rapid increase in resistance. Efforts to suppress water consumption during the initial stages of the cycle effectively enhanced the cycle life. However, the slow consumption by the passive path cannot be ignored because the cell can run until the water is nearly depleted.
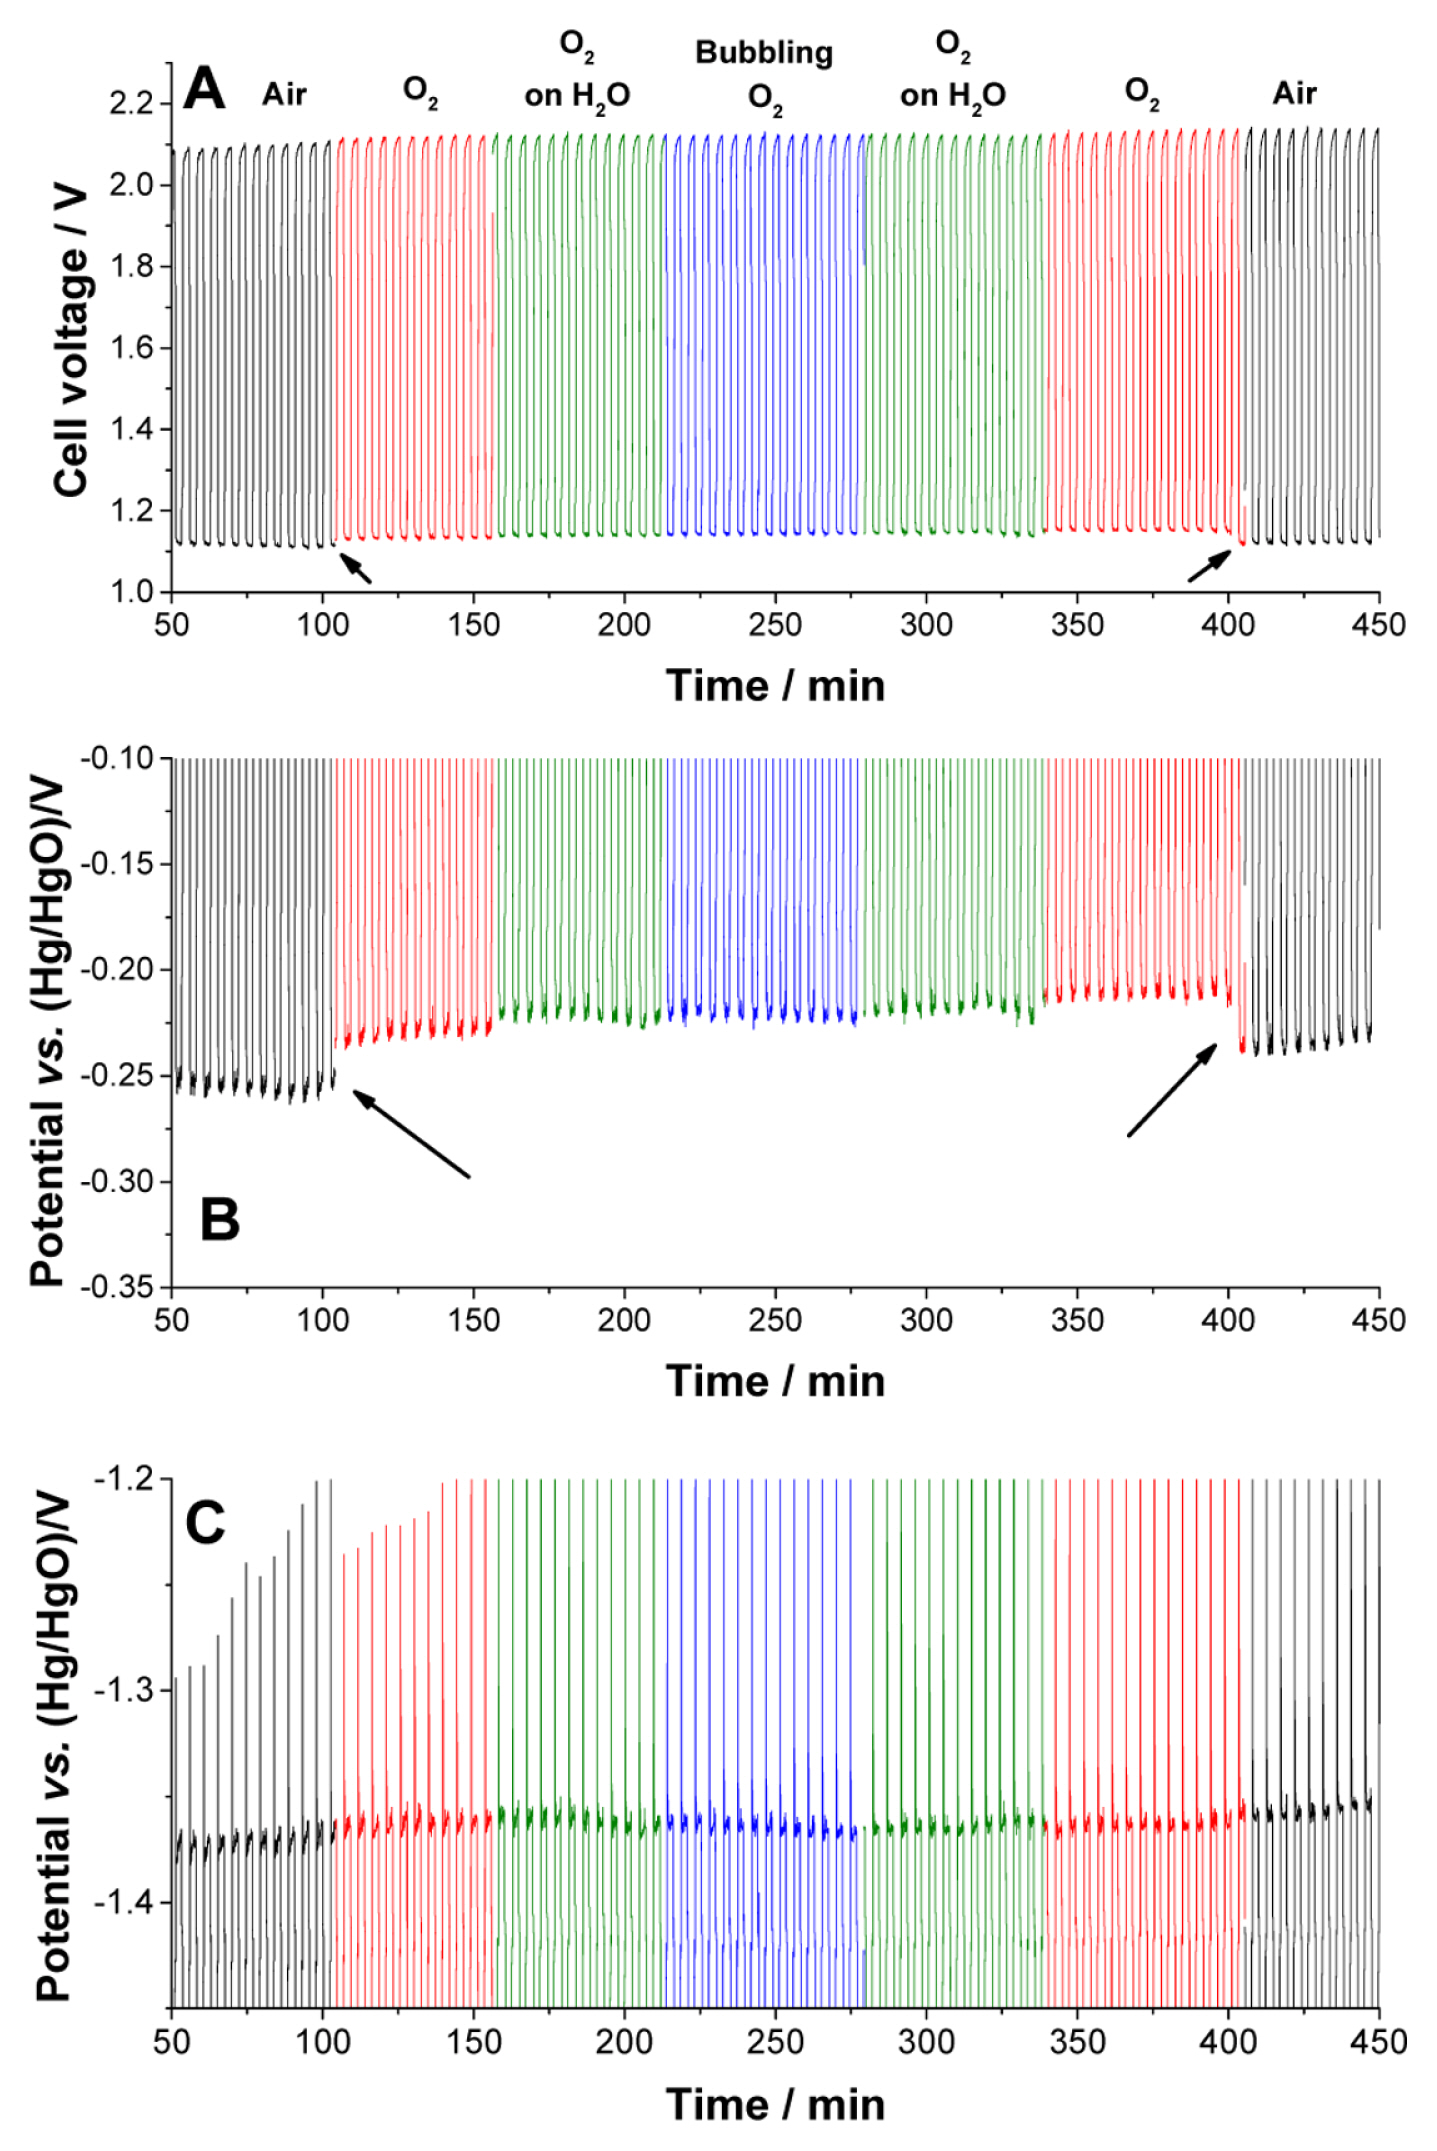
Since the electrolyte is injected into the cell only once, the quantities of water, Zn, and OH ions are limited. The concentrations of oxygen and water can vary depending on the air supplied to the cell. The dependence of oxygen and water on the cell voltage is monitored by changing their concentrations. The cell was placed in a faraday cage, which was 25 cm ├Ś 25 cm ├Ś 30 cm in dimension. The air in the cage was replaced by oxygen at a flow rate of 100 mL/min. In order to observe the dependence of water on the cell voltage, the following three methods were used. An empty wash bottle was used for pure oxygen supply. Half of the wash bottle was filled with water, and oxygen was passed above it (O2 on H2O). This incorporated some moisture in oxygen. The oxygen bubbles (bubbling O2) were passed through the water to increase the concentration of water in oxygen. A cycle test was performed with air, O2, O2 on H2O, and bubbling O2 to determine the influence of the gas in the test. Fig. S5 shows the cell voltage, cathode potential, and anode potential.
There was no significant change on the cell voltage upon changing the gases in most of the cases. The only exception was when the gas was changed from air to oxygen or oxygen to air during the discharge process. Changes in the voltage upon changing the oxygen concentration are indicated by arrows in Fig. 4A. The cell voltages in the presence of oxygen gases (O2, O2 on H2O, and bubbling O2) are similar. The voltage change in the cell owing to the change in oxygen concentration originated from the reaction at the cathode. Fig. S5 shows the cathode potential with varying gas contents, and Fig. 4B shows the same at an enlarged scale. However, the gases had a negligible influence on the potential changes at the anode (Fig. 4C). The discharge potential of the anode showed no dependence on either oxygen or water in this measurement. If the cell runs for a longer time such that the depletion of water is significant, the water in the gas can help to maintain the potential. Sharp potential spikes (potential drop) are formed at every cycle (Fig. 4C), which could be caused by the formation of resistive compounds, such as ZnO. The intensities of the spikes gradually increase along with an increase in the noise (Fig. S5 and S6) because of the accumulation of ZnO, which results in the termination of the cycles at extended times.
The discharge reactions at the electrodes are represented by Equations 7 and 8, which are the reverse reactions of those in Equations 3 and 4.
Both O2 and H2O are the reactants in Equation 7. Changing the gas from air to oxygen increased the concentration of oxygen significantly. Increase in oxygen favors the discharge reaction at the cathode. However, moisture from the gas flow has a negligible effect on the reaction, because the electrolyte already has enough water. Supply of moisture can favor the reaction in Equation 7 and maintain the conductivity of the electrolyte for longer cycles. We have not yet verified the influence of moisture on the longer cycles. Variation in oxygen and water is not directly related to the reactants of the reaction in Equation 8 under the current experimental conditions. As long as air is used as the reactant, no significant changes should be observed in the discharge potentials, regardless of the atmosphere around the cell. The role of KOH concentration in reducing water consumption [29] should be investigated in further studies. Depending on the KOH concentration, the contribution of the electrolysis to the water consumption can vary. Because the electrolysis occurs on Zn particles that corrode, the dependence of KOH concentration should be observed carefully.
4. Conclusions
Water loss by electrolysis, which constitutes the active path, is much faster than the processes constituting the passive path during the early stage of the cycles. Although the active path slows after 10 h of cell operation, the passive path persistently consumes water. Electrolysis contributes two-thirds of the electrolyte consumption at 24 h of cell operation in 4.0 M KOH solution. Efforts to suppress water consumption during the initial stages effectively enhanced the cycle life. Because a small amount of water can run the cells, suppression of the passive path cannot be ignored for cycle life extension. Concentrated oxygen, rather than air, favored the discharge reaction at the cathode. However, moisture in the gas makes no detectable improvements either at the cathode or at the anode under our experimental conditions. If the cells run for a longer time, the moisture in the gas, which retains water in the cell, can extend the cycle life of the cell.