1. Introduction
Zinc-air batteries have many advantages such as a high theoretical energy density (1,084 Wh kgŌłÆ1), low cost, environment friendliness, flatness of discharge voltage, and the use of non-platinum catalysts [1ŌĆō7]. For these reasons, much effort has been invested to develop a secondary battery capable of electrochemical charging. However, Zinc-air secondary batteries have not yet reached the practical application level due to many problems that interfere with their repeated and stable charging and discharging, such as the irreversible zinc oxide formation during discharge [1,6,8], dendritic growth of zinc during charging [9,10], absence of cathode catalyst that enables both oxygen reduction and oxygen generation [6,11], poor cathode durability [6], low coulombic efficiency [7,12], and zincate ion cross-over [13].
Strategies for overcoming each aforementioned issue and realizing electrically rechargeable Zinc-air battery have been suggested, for example, as follows: the suppression of Zn oxide formation by the limit of depth of discharge [8] or the use of zincate ion scavengers [14ŌĆō16], the suppression of Zn dendritic growth by electrolyte additives [17ŌĆō19], the prevention of air cathode degradation by adopting the 3rd electrode exclusively used during charging [20], and the improvement of the coulombic efficiency by electrolyte design [12].
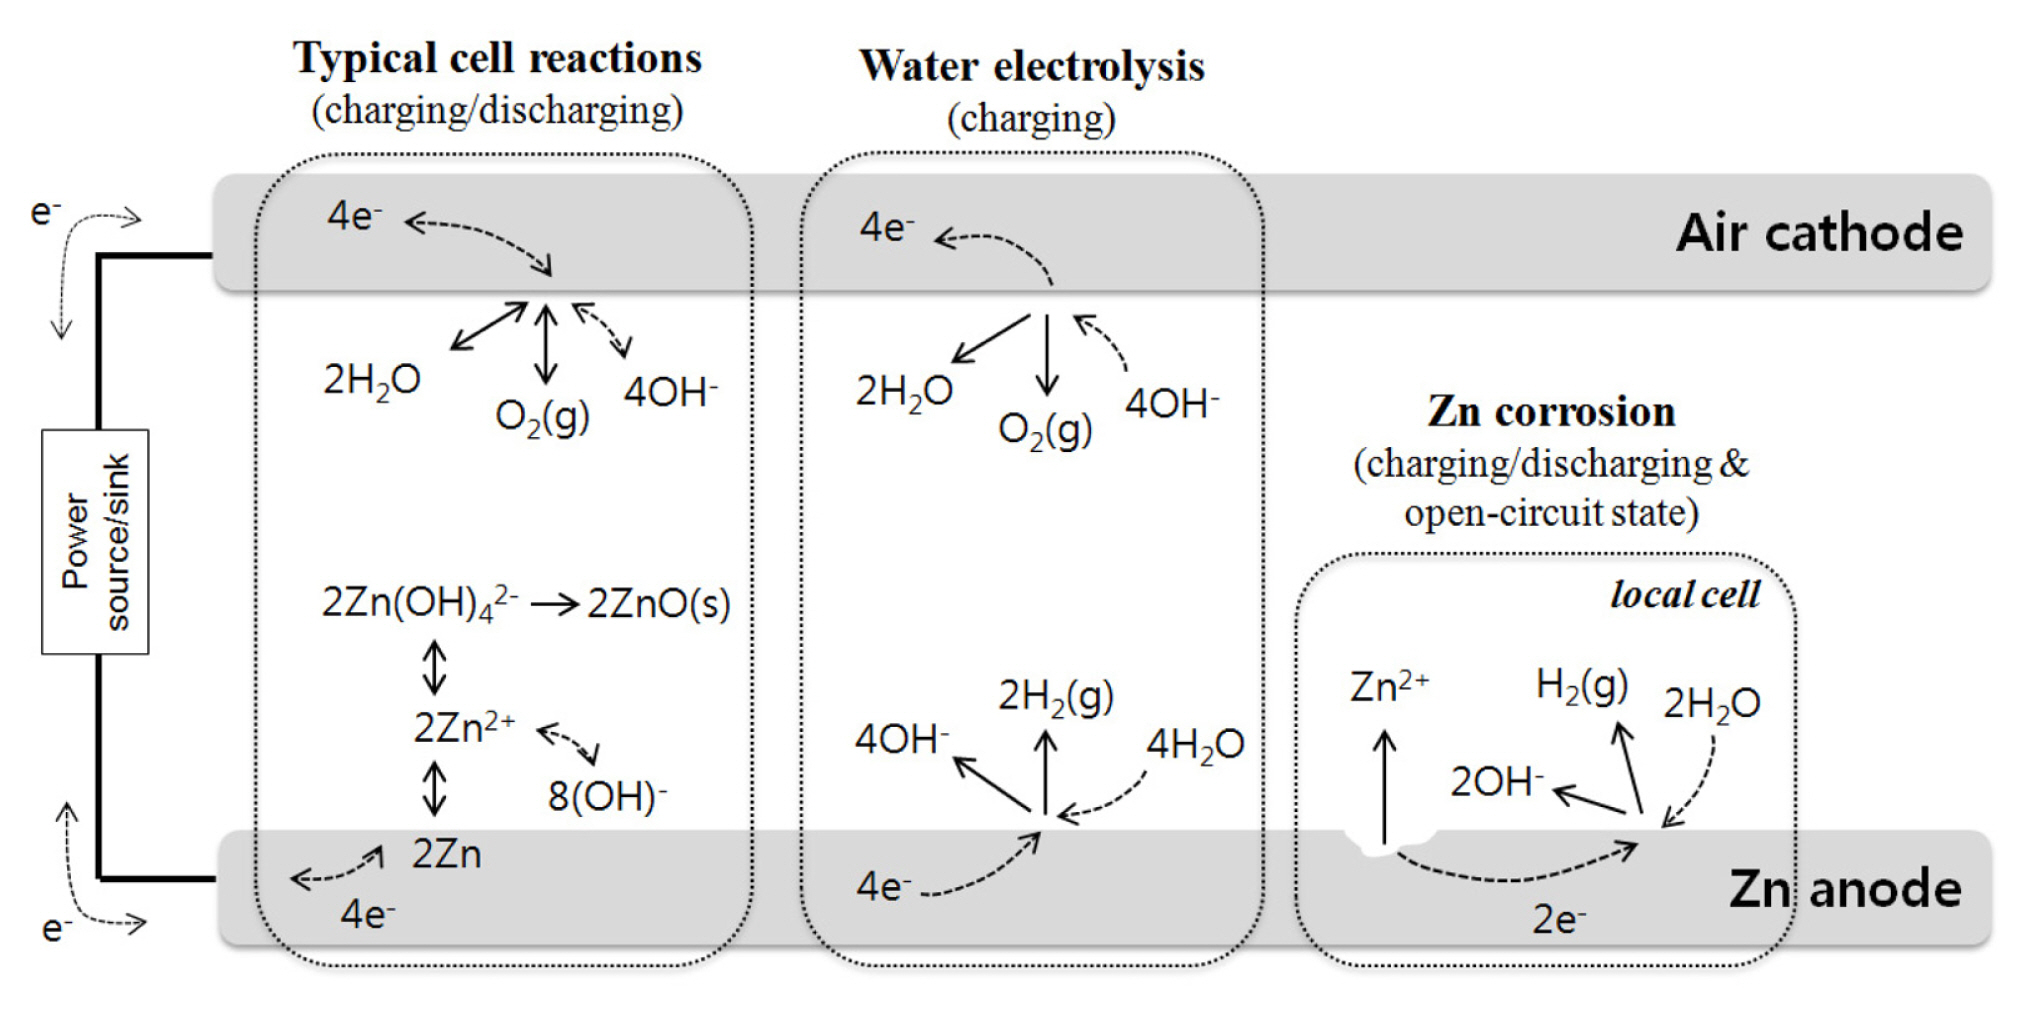
In particular, low coulombic efficiency is due to charge losses whose main cause is known to be zinc corrosion (self-discharge) in the alkaline electrolyte [22,23] and water electrolysis under a high overvoltage during charging [24,25]. Various mechanisms of zinc corrosion in alkaline solution have been suggested in the literature, and they always result in the following local cell reactions:
As for water electrolysis, the following reactions occur during charging process.
The above main side reactions along with typical cell reactions in Zinc-air secondary battery is schematically presented in Fig. 1.
Unfortunately, many studies have focused only on the charge-discharge cycle characteristics, and have shown relatively little interest in coulombic efficiency, which is one of the most important practical features of zinc-air secondary batteries. As a result, to the best of our knowledge, the causes of low coulombic efficiency are only briefly mentioned in a qualitative approach in most reports, and no attempt has been made to interpret them systematically and quantitatively.
In this study, we present a very simple method to quantify the contribution of side reactions (i.e., water electrolysis and self-discharge) that have a decisive influence on coulombic efficiency. It consists of only simple closed circuit/open circuit experiments and related calculations. In particular, the method enables to separate the amount of externally applied charges into the amount used for the desired zinc reduction, amount lost due to water decomposition, and amount lost due to zinc corrosion (self-discharge). The method will be applied to two cell designs with different coulombic efficiency, in order to demonstrate its usefulness.
2. Experimental
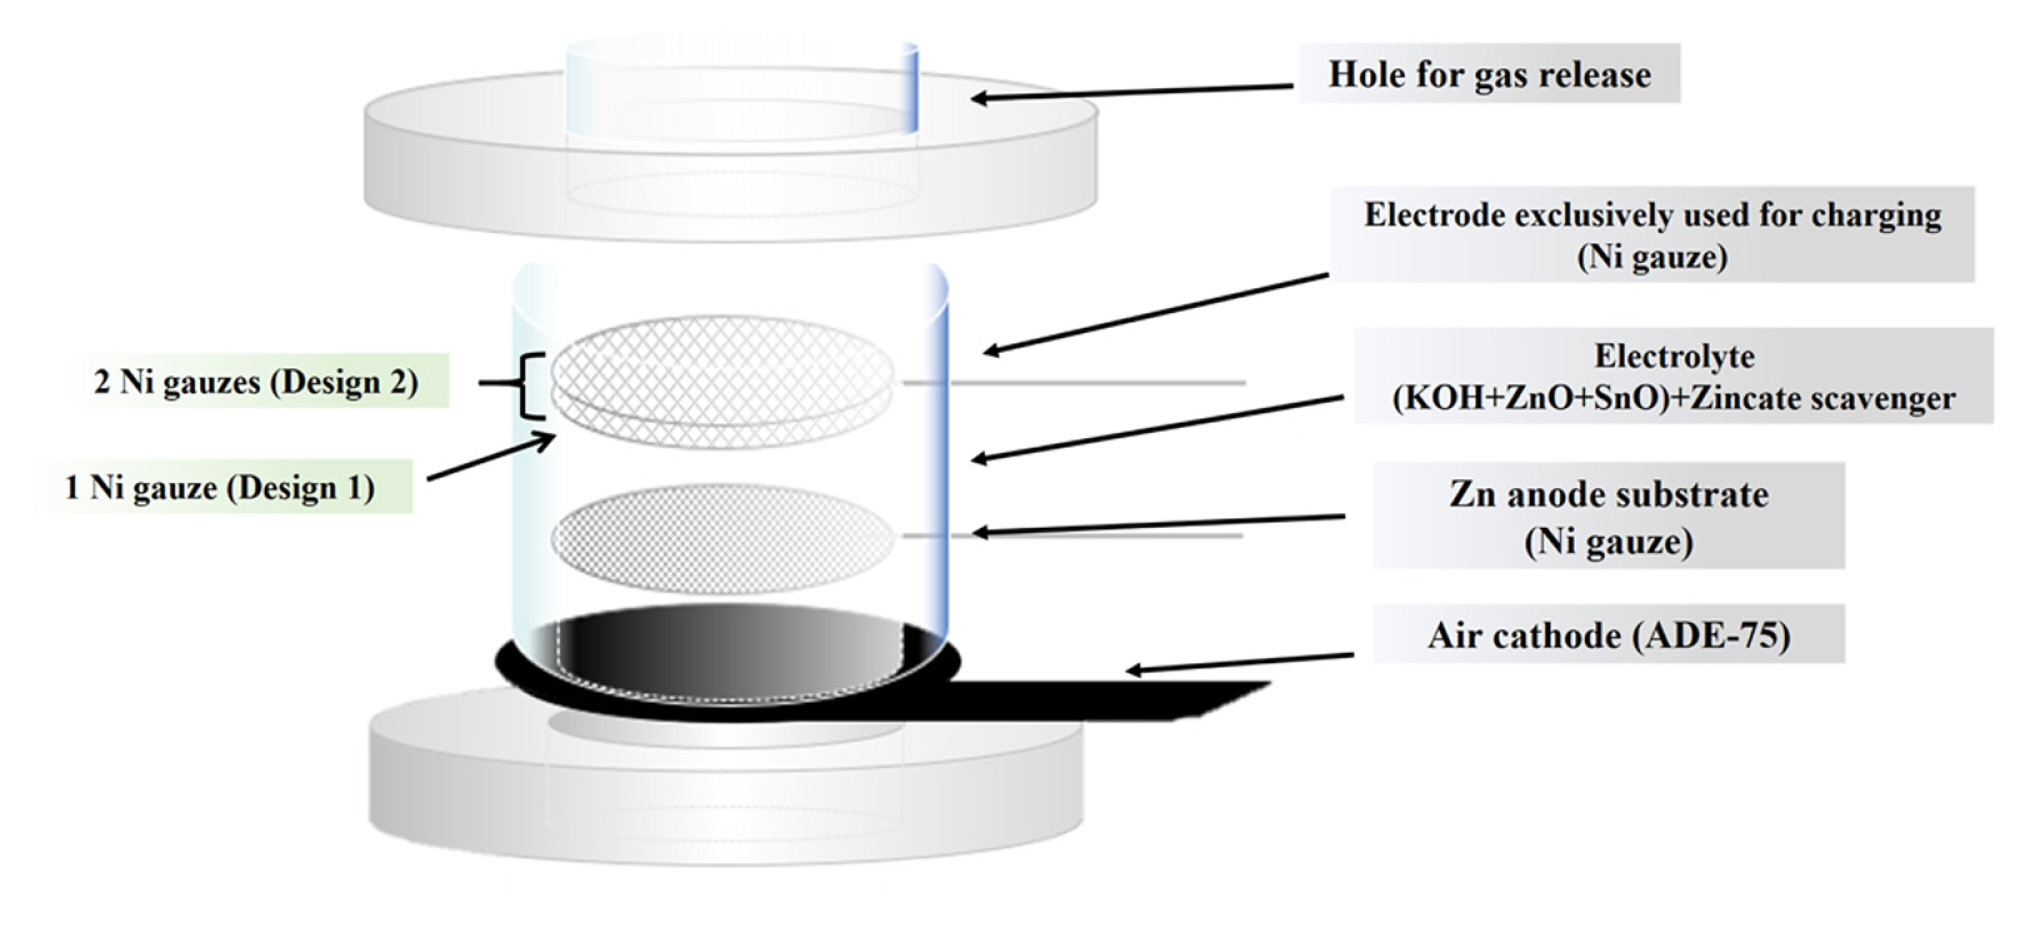
The Zinc-air test cell used in the work is schematically given in Fig. 2. The cell was fundamentally composed of a conventional air cathode which was cobalt oxide-catalyzed activated carbon on Ni foam (ADE-75, MEET, Republic of Korea) and nickel gauze (100 mesh woven from 0.1 mm diameter wire, Alfa Aesar, U.K.) as the anode substrate. That is, the prepared cell is in a completely discharged state, where the anode substrate is free of zinc. In addition, since the durability of the air cathode, which is the one usually used in the primary cell, against the oxygen evolution reaction was not guaranteed, nickel gauze (60 mesh woven from 0.18 mm diameter wire, Alfa Aesar, U.K.) was used instead of the air cathode for charging to prevent data distortion due to durability degradation.
The electrolyte was prepared by dissolving 4 M KOH, 0.2 M ZnO, and 3 mM SnO in deionized water. ZnO serves as the source of zincate ion, and SnO is an additive that inhibits dendritic growth when zinc is plated on the nickel gauge during charging [26]. Furthermore, calcium zincate (Ca(OH)2┬Ę2Zn(OH)2┬Ę2H2O) powder was added to the electrolyte to supply zincate ions depleted during charging [23, 24] and at the same time to maintain the zincate ion concentration in the electrolyte below its solubility limit during discharging. That is, the detrapping and trapping of zincate ions take place in the course of charging and discharging, respectively, according to the reaction (Ca(OH)2┬Ę2Zn(OH)2┬Ę2H2O+4OHŌłÆ = Ca(OH)2+2Zn(OH)42ŌłÆ+2H2O).
In this study, the detailed reactions occurring during the zinc-air secondary battery operation were quantified from the following two cell designs. As denoted in Fig. 2, one piece of the charge-only nickel gauge (apparent area = 4.7 cm2) was used in Design 1. The charge current density was 10 mA cmŌłÆ2 and the charge time was set as 1.33 h, so that the charged amount was 13% of the design capacity (493.1 mAh). The discharge current density was 5 mA cmŌłÆ2. Whereas, in Design 2 two pieces of the charge-only nickel gauze (apparent area = 9.4 cm2) were used in the expectation of reducing the overvoltage during charging and then getting relatively high coulombic efficiency as compared to Design 1. Under the same charge current, the charge time was increased to 5 h to achieve a charge amount of 47% of the designed capacity. In the above two designs, the reason for the considerably low charge amount (especially in Design 1) is the accumulation of the gas generated during charging within the cell as deeper charge progresses. This yields a very unstable charge curve and results in difficult analysis. After charging/discharging proceeded as above, the battery was again charged under the same conditions and then self-discharged in the open circuit state.
In addition, in order to get the basic information about the charge/discharge characteristics of Design 1 and 2, the galvanostatic charge/discharge were obtained for the first five cycles at the current densities of 10 (for charge) and 5mA/cm2 (for discharge) All electrochemical experiments were carried out using a BasyTec Cell Test System (BasyTec, Germany).
3. Results and Discussion
To analyze the amount of externally applied charge used for the actual zinc reduction reaction (referred to as charge efficiency), two major side reactions of water electrolysis and zinc corrosion (self-discharge) are considered and the charge/discharge experiments followed by charging and open-circuit self-discharging experiments are carried out.
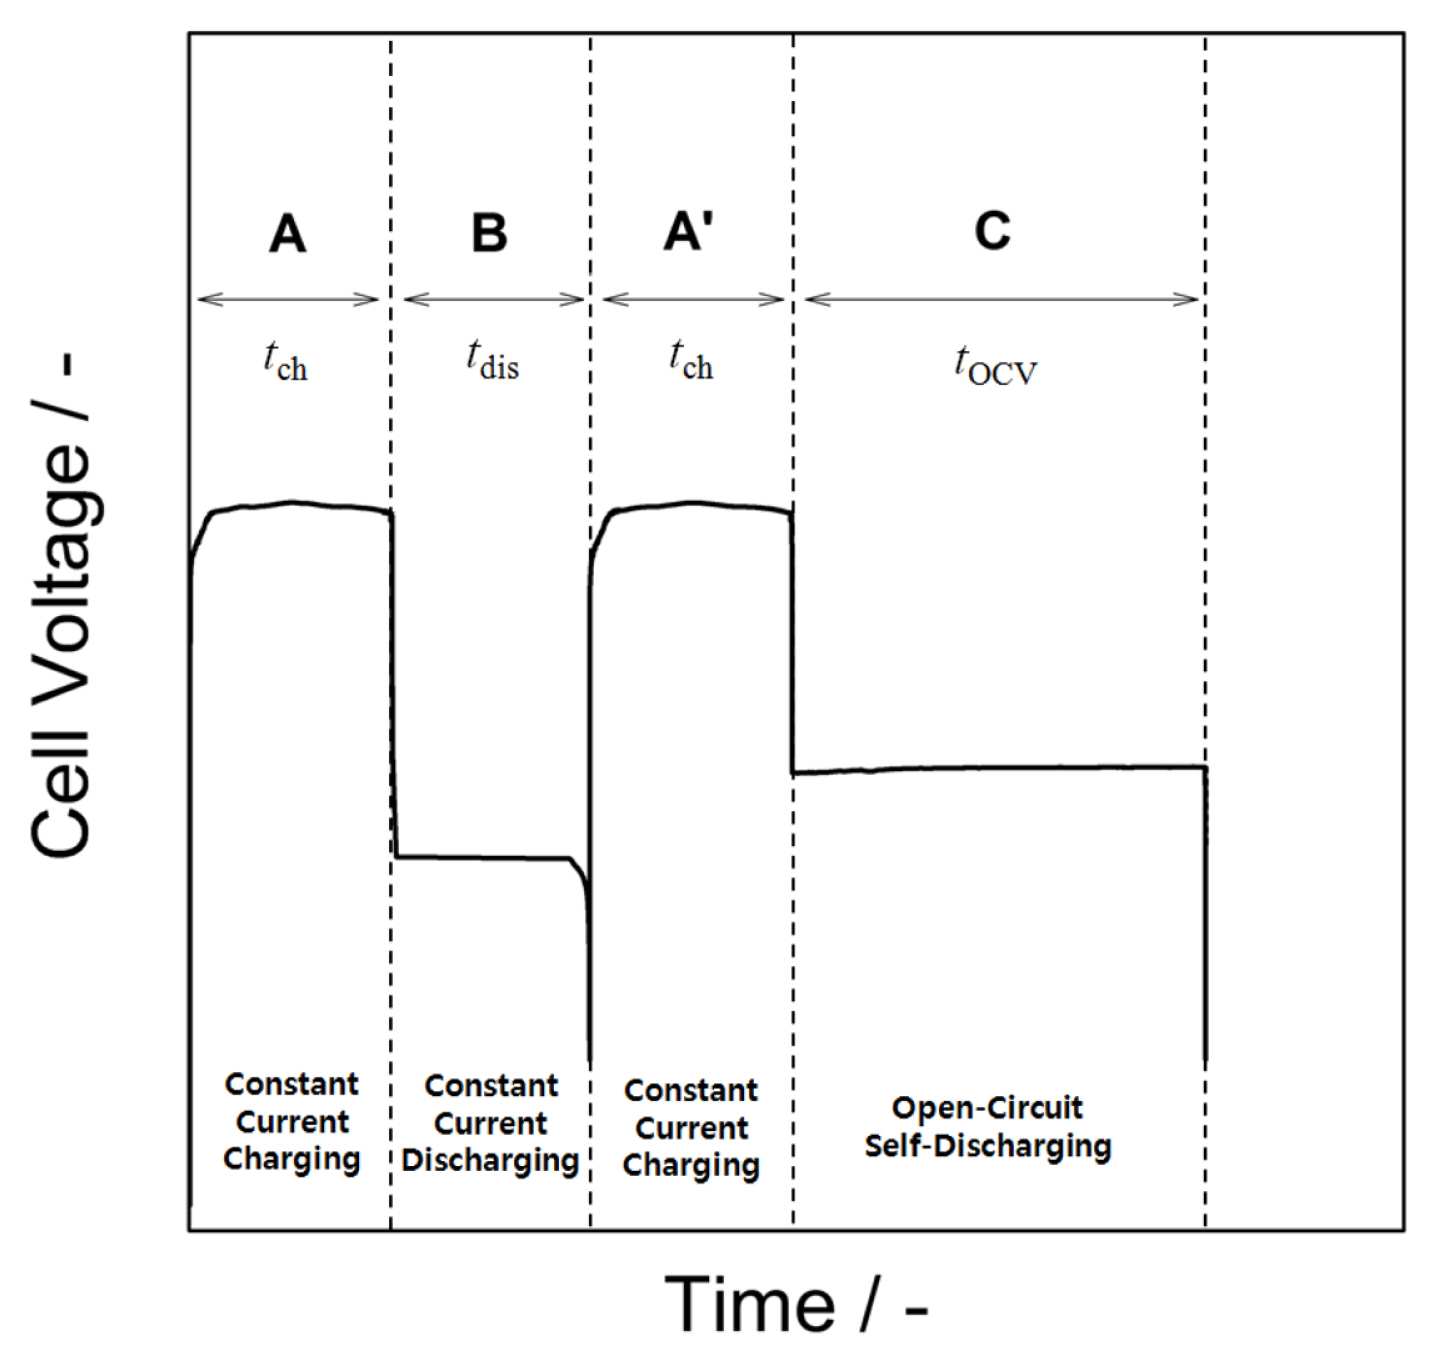
The ideal hypothetical voltage curve to be obtained through this experiment is shown in Fig. 3. The following three factors were considered for calculating the charging efficiency: 1) the charge current is used for the zinc reduction reaction and water decomposition reaction, during which self-discharge from zinc corrosion proceeds simultaneously; 2) the discharge current is used for zinc oxidation, during which selfdischarge from zinc corrosion proceeds simultaneously; and 3) when the open circuit is maintained after charging, only self-discharge from zinc corrosion occurs.
Subsequently, the contribution of each segmented reaction during charging, that is, the amount of charge used for zinc reduction (QZn), the amount of charge lost by water decomposition (QWD), and the amount of charge lost by zinc corrosion (self-discharge; QSD) was calculated by the following procedure. Note that QZn is related to the amount of charge used for actual zinc reduction during charging, excluding QSD, i.e., the amount of zinc remaining after charging is complete. First, the charge amount (Qch) and discharge amount (Qdis) can be expressed as follows:
Here, QSD,ch and QSD,dis are the amounts of self-discharging charge during charging and discharging, respectively. In addition, the self-discharged charge amount in the open circuit state after charging (QSD,OCV) is equivalent to the amount of zinc capable of oxidation (i.e., QZn).
Moreover, QSD,OCV can be written as follows using time tOCV of region C in Fig. 3.
Here, ISD is the self-discharging current and is assumed a constant regardless of time. If self-discharge is assumed to progress independently regardless of the charging/discharging process, QSD,ch and QSD,dis can be expressed as follows.
where tch and tdis are the time required for charging and discharging, respectively (region A (or AŌĆ▓) and B in Figure 3, respectively). Combining Eqs. (2) and (3):
Here, tOCV, tdis, and Qdis are experimental variables or values that can be determined through experiments. Consequently, ISD can be determined from Eq. (8). Thus, QZn (excluding the self-discharged amount) can be calculated from Eqs. (3) and (4), while QSD,ch and QWD can be calculated from Eqs. (5) and (1), respectively.
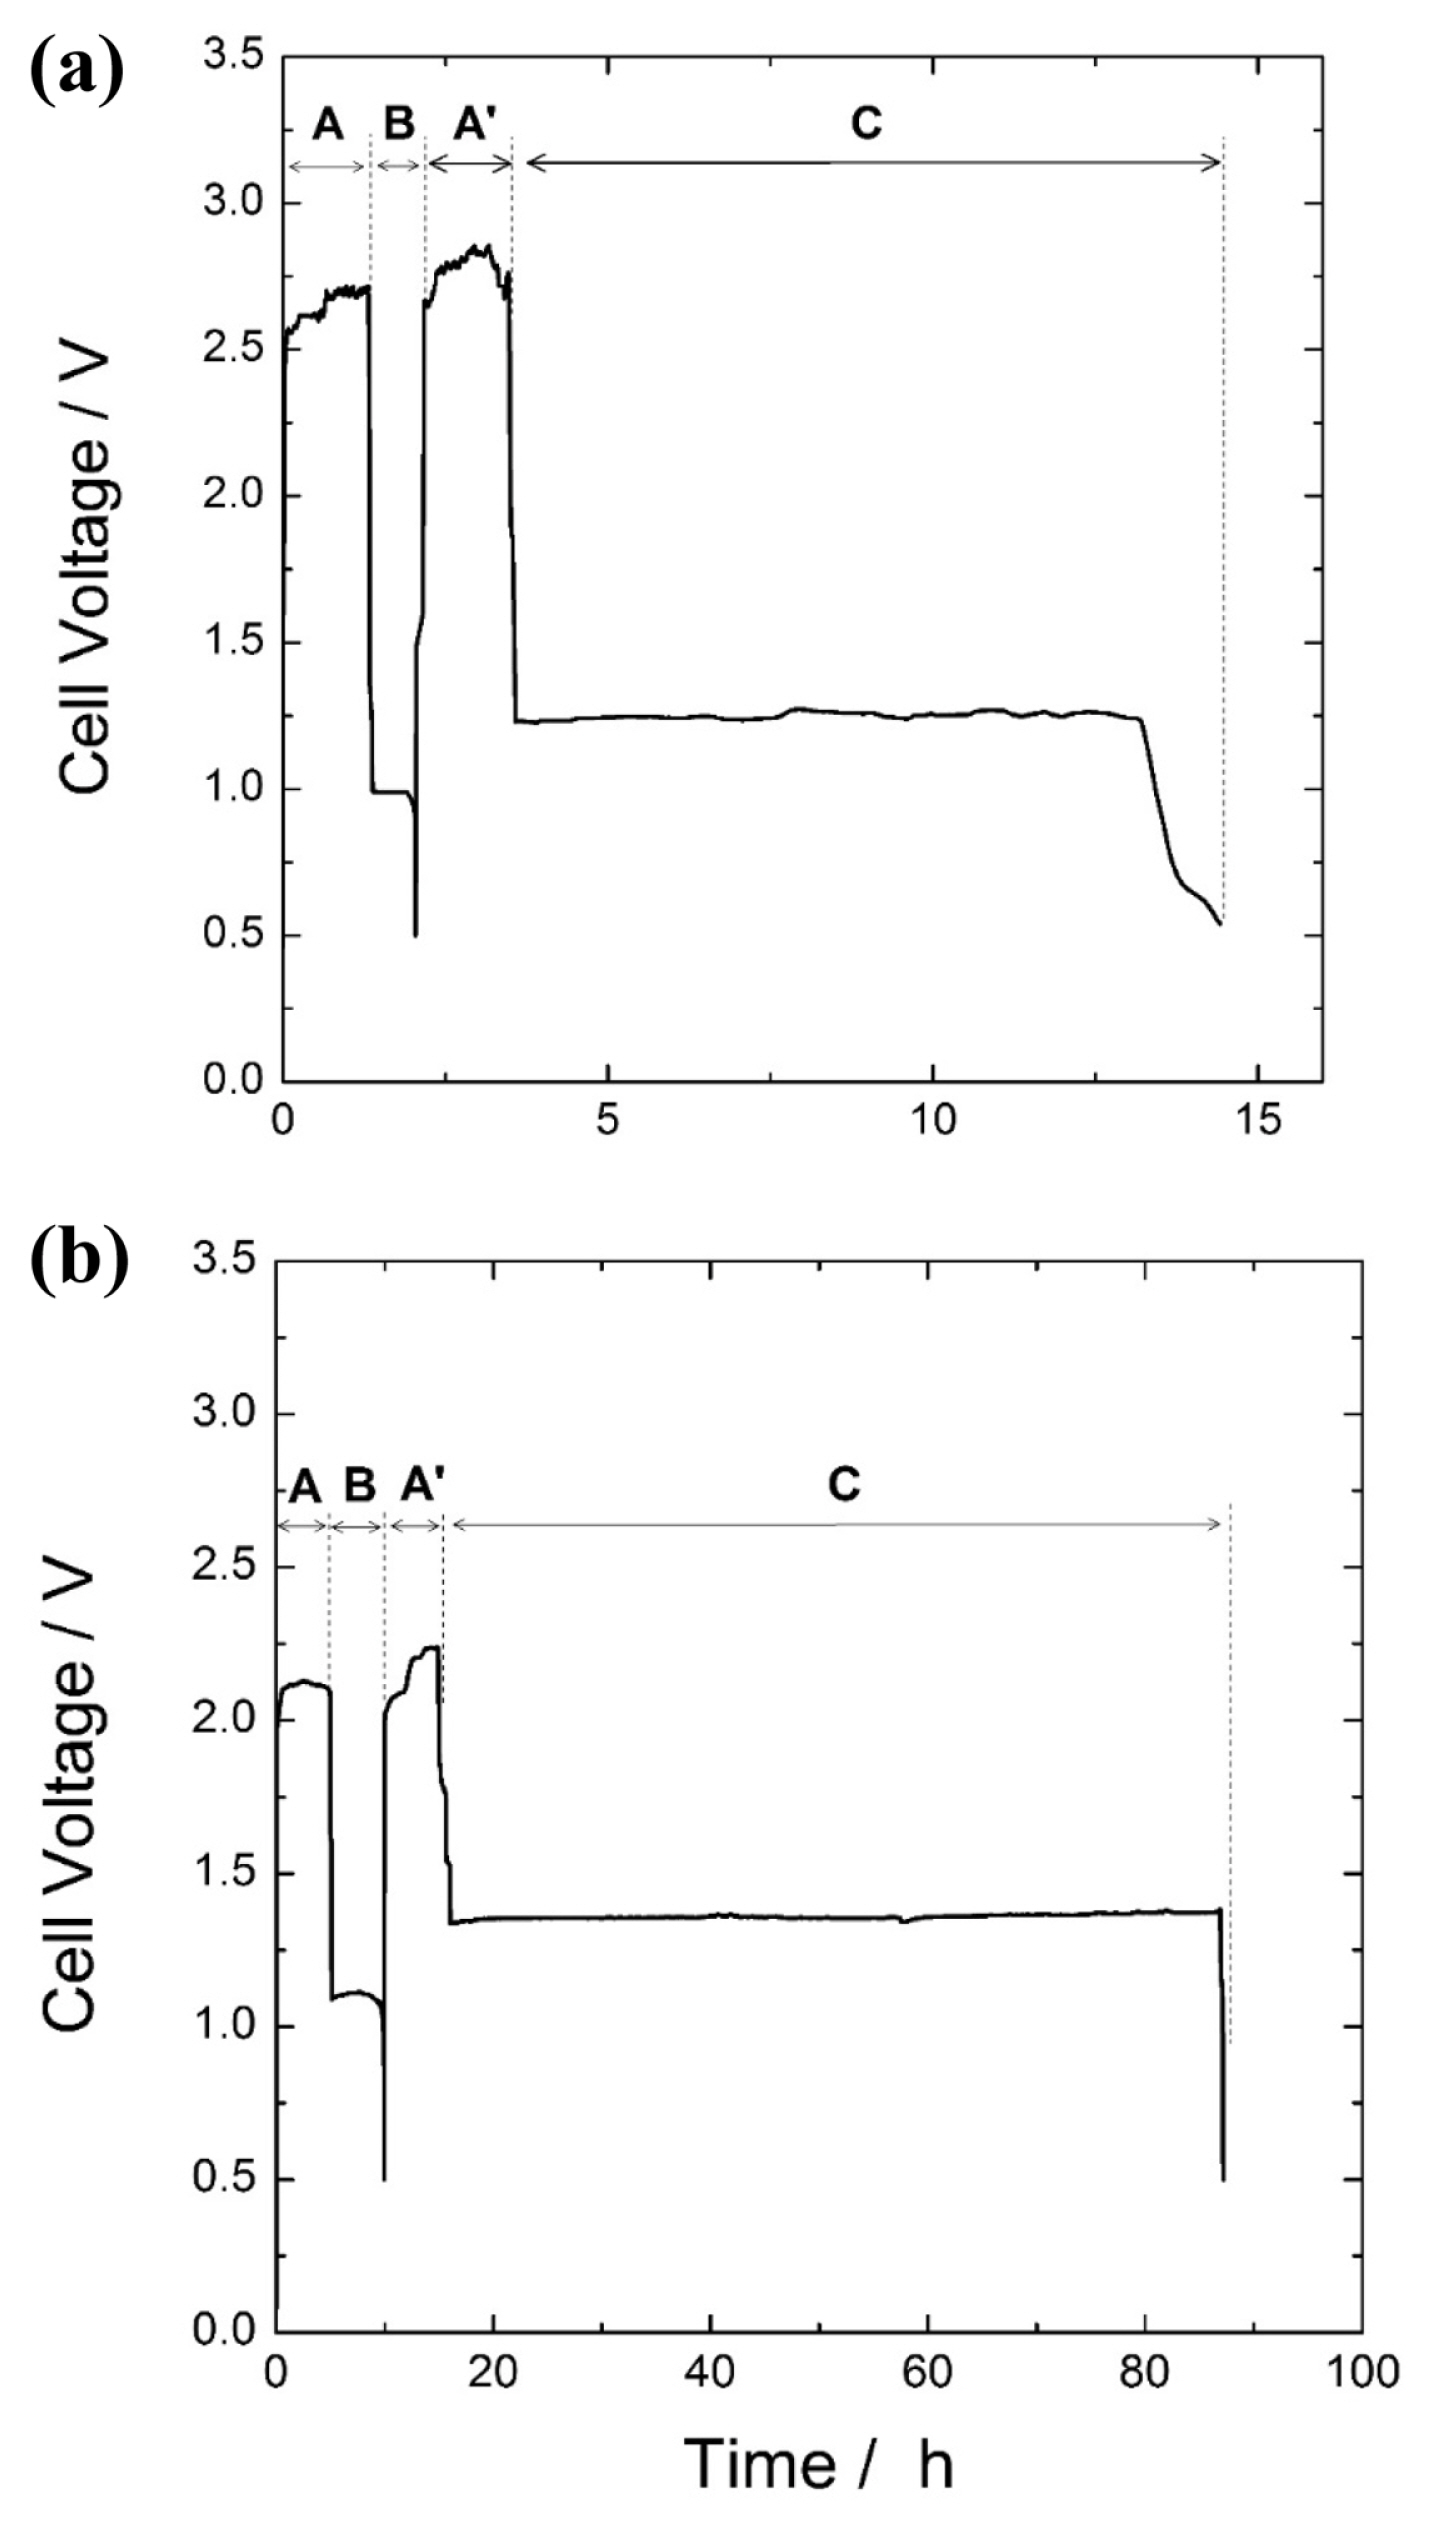
The abovementioned experiment was performed for the cell in Design 1, and the resulting voltage curve is shown in Figure 4(a). The values determined from the experiment are tch=1.33 h and Qch=62.22 mAh in the charged region (A or AŌĆ▓), tdis=0.71 h and Qdis=16.65mAh in the discharged region (B), and tOCV=11.08 h in the open circuit region (C). The self-discharged current obtained from Eq. (8) using these values gives ISD=1.60 mA. Thus, QZn, QWD, and QSD,ch were subsequently calculated as 17.79, 42.30, and 2.13 mAh, respectively. There are two noteworthy aspects here. First, the charge amount used for zinc reduction during charging is actually QZn+QSD,ch as mentioned above; however, the charging capacity decreases as the reduced zinc re-oxidizes by self-discharge. Second, the charge capacity in the current design conditions, that is, the contribution of charge amount to zinc reduction (the remaining amount without self-discharge) is about 28.6% (=QZn/Qch). Due to the low charging efficiency, the coulombic efficiency is also very low at 26.8% (=Qdis/Qch).
Next, the same experiment was performed for the cell that had a large-surface area charge-only electrode to reduce the charging overvoltage (Design 2) and was driven to a deeper charge depth. The resulting voltage curve is shown in Figure 4(b). The values determined from the experiment are tch=5 h and Qch=233.4 mAh in the charging region (A or AŌĆ▓), tdi s=4.87 h and Qd i s=113.68 mAh in the discharging region (B), and tOCV=72 h in the open circuit region (C). Again, using these values, the self-discharge current is determined as ISD=1.69 mA. Further, the individual charge amounts consumed during charging are calculated as QZn=121.91 mAh, QWD=103.04 mAh, and QSD,ch=8.45 mAh. The values obtained from cell Design 1 and 2 are summarized in Table 1. Remarkably, the charge consumption due to water electrolysis significantly decreased from about 68.0% (Design 1) to 44.3% (Design 2) of the total charge amount. As a result, the charging efficiency and coulombic efficiency of Design 2 increased to 52.2% and 48.7%, respectively. The results show that the cell design intended to decrease charge loss and increase charging and coulombic efficiencies by reducing the charging overvoltage can be verified by the calculation method presented in this study.
Shown in Figs. 5(a) and (b) are the galvanostatic charge/discharge curves of Design 1 and 2 for the first five cycles. The coulombic efficiency of Design 1 and 2 was in the ranges of 20ŌĆō30% and 40ŌĆō60%, respectively (insets in Fig. 5), throughout the whole charge/discharge cycles, consistent with the data in Table 1. Two points need to be mentioned about the results. (1) In case that the depth of charge is shallow (Design 1, Fig. 5(a)), the charge curve was relatively stable. But, the other one (Design 2, Fig. 5(b)) featured the intermittent short circuit during charging mainly due to the severe growth of Zn dendrite. This might be alleviated by the use of more effective additives for the suppression of Zn dendrite growth, like polyethylenimine [18]. (2) Charging curve is neither stable nor consistent in view of overvoltage. This is largely because of the interference by gas bubbles coming from the water electrolysis. The Zinc-air cell used in this work has a large hole where the generated gas during charging process goes out, but the gas bubbles temporarily stuck inside the cell might make the charging curve quite unstable. For the use under the deep charging condition and/or vigorous gas evolution, more open construction of the cell is needed.
In this paper, we aimed to quantify the contribution of zinc reduction and other side reactions during the Zinc-air secondary battery charging; therefore, a design with a relatively low efficiency was used as an example. Both water electrolysis and self-discharge rely heavily on the morphology of zinc reduced and plated during charging. With an increase in the dendritic growth of zinc, the surface area of zinc increases and the charge amount consumed by these two side reactions greatly increases, resulting in decreased efficiency. In addition, when the concentration of zincate ion in the alkaline electrolyte is above the solubility limit during discharging, zinc oxide is deposited on the active material to increase the reaction overvoltage [8], thereby promoting water electrolysis during subsequent charging, which may lead to a decrease in efficiency. Thus, the suppression of dendritic growth during charging and inhibition of zinc oxide precipitation during discharging have been previously reported to be indispensible for realizing a Zinc-air secondary battery [6,7]. A study of the cell design that improves the above two key issues and separates the contribution of side reactions by applying the method proposed in this study will be subsequently published.
4. Conclusions
This study proposed a simple method to quantify the contribution of side reactions, which have a critical effect on the coulombic efficiency of Zinc-air secondary batteries. From the experimental data and the equations derived in this work, the self-discharge current was determined, and the contribution of main side reactions such as the charge amounts consumed by self-discharge and water electrolysis during charging could be estimated. By applying the proposed method to two cell designs with different charging overvoltages, it was found that the amount of charge consumed by water electrolysis during charging greatly decreased with a reduced charging overvoltage, which resulted in increases in charging and coulombic efficiencies. The method proposed in this study is expected to be used not only for a Zincair secondary battery, but also as a simple tool for diagnosing other metal-air batteries with similar reaction mechanisms and interpreting the effects of side reactions.