1. Introduction
Copper powder occupies the most important part of powder metallurgy, compared to other metal powders. Among them, dendritic copper powders prepared by electrolysis have a wide range of applications in different industrial fields due to their unique microscopic morphology, large relative specific surface area and good chemical properties.
The generation of dendrites in electrodeposition has attracted the interest of a wide range of scientists because of its formal symmetry and substantive complexity. Numerous scholars around the world have conducted in-depth researches on the process of electrolytic copper powder and made improvements, but most of them focus on the optimization of process parameters and the pretreatment and post-treatment of copper powder [1–5]. There are few in-depth reports on the influence of fractal growth of copper powder dendrites on the morphology of copper powder prepared by the electrolytic method.
DLA problems like dendrites are difficult to deal with using conventional Euclidean geometry, and even numerical solutions cannot be obtained. Until 1977, when Mandelbrot studied the geometry of nature and coined the term fractal [6], fractal geometry has developed rapidly. It has been suggested that the complexity of the growth of electrodeposited metal dendrites is due to the instability of the flow field morphology, providing new ideas for the study of metal dendrite factorisation [7–10]. N. M. Santos et al. [11] showed that the fractal growth of dendrites is mainly affected by the concentration of the electrolyte and applied potential or current. L. Avramović et al. [2] showed that the current density affects the degree of hydrogen precipitation during electrolysis which alters the dispersion of the deposited copper.
Accordingly, this paper attempts to combine fractal theory and the DLA model, using electrolysis to prepare fractal products of copper deposition by controlling the applied voltage, copper ion concentration and acidity conditions, and to investigate the morphology and fractal dimension relationship of electrodeposited copper dendrites.
2. Experimental
The experimental setup is shown in Fig. 1, using a Petri dish as a container, with a ring-shaped copper metal sheet surrounding the rim of the Petri dish as the anode and a fine copper wire suspended above the center of the Petri dish as the cathode, with the ring-shaped copper metal sheet and the suspended fine copper wire connected to the positive and negative terminals of the DC power supply respectively. To facilitate sampling, filter paper was invoked as a carrier for the electrodeposition of copper. Analytically pure sulphuric acid and copper sulphate were employed in the experiments, which were mixed with demonised water and prepared into electrolytes with different copper sulphate concentrations for use. The experiments were conducted at a constant applied voltage in the range of 1 to 20 V.
The experimental procedures were shown as follows: place a glass surface dish inside a Petri dish and lay the filter paper moistened with electrolyte on the surface dish; add electrolyte from the edge of the Petri dish so that the edge of the filter paper is in contact with the electrolyte, The cathode copper wire is inserted and the tip of the wire is in contact with the wetted filter paper, and the copper metal is quickly deposited near the cathode when the power is switched on.
3. Results and Discussion
The following reactions may occur during the electrodeposition of flat plate electrochemical cell. Several reactions take place at the cathode, one producing deposited copper, one producing hydrogen and the other producing copper oxide.
3.1. Current-time evolution
Fig. 2 shows the evolution of the current with time during the electrodeposition of copper (current was taken every 0.5 s). The currents through the device all increase gradually with electrodeposition time, both at constant applied voltage (6 V) and constant copper sulphate concentration (0.4 mol/L). There is a sharp increase in the early stages of deposition, followed by a linear increase.
The increase in current with time is caused by the decreasing distance from the ring copper anode to the deposited cathode cluster as the deposited product grows. The distance (L) over which the copper ions need to move decreases with time as they are filed. That is the system’s net resistance (R = ρL/S) decreases with deposition, resulting in an increase in current at a constant applied voltage between the two electrodes.
3.2. Growth regimes
The extent of these reactions varies at different ion concentrations and voltage values. In flat plate electrochemical cell, as the growth proceeds, the ion concentration and voltage near the interface change, resulting in different reduction products and corresponding changes in the morphology and color of the deposit.
The extent of these reactions varies at different ion concentrations and voltage values. In flat plate electrochemical cell, as the growth proceeds, the ion concentration and voltage near the interface change, leading to distinct reduction products and corresponding changes in the morphology and color of the deposit.
The reported metal plating layers in flat plate electrochemical cells have atypical growth states, which are the DLA, dense, dendritic, open and mixed respectively. This study was carried out in a flat horizontal cell with a disordered thick, dense radial, dense dendritic and sparse dendritic growth regime of copper electrodeposits. They summarise in the diagram of morphology shown in Fig. 3.
Electrolytes with low sulphuric acid concentrations, a homogeneous (dense and neatly dendritic) pattern is noted. In this case, clear growth fronts parallel to the cathode are the deposit. When the applied potential increases, the current density in the two-dimensional dendritic copper dendrites also rises, resulting in faster nucleation of the copper powder and a tendency for the coating morphology to acquire a sparse dendritic structure. The analysis indicates that the hydrogen precipitation side reaction increases with increasing acidity and that the hydrogen precipitation path determines the growth path of the electrodeposited copper dendrites. At moderate sulphuric acid concentrations, typical dendritic branching was obtained. Finally, at larger electrolyte concentrations, the morphology of the layer clearly depends on the applied potential values: (a) at lower voltages, densely deposited copper with tip splitting characteristics is formed; (b) at intermediate potential values, a mixed deposited copper was formed. These structures consisted of tree-like trunks with open branches and homogeneous dendrites; and (c) finally, at larger potential values, thickly deposited copper with short branches was obtained.
In addition, relatively regular dense clusters are always observed in the innermost part of the deposited product, which is caused by the drift deposition of ions in the electrolyte during the initial phase of copper deposition. The initial abrupt increase in current is mainly due to the ion drift current. After a transition period, a reformation of positive and negative ions occurs in the solution and then the metal ions (or ion clusters) move and are deposited in a diffusive manner.
3.3. Fractal dimension
The main concept of fractal geometry is the fractal dimension. Literally, a fractal dimension is a dimension that can be a fraction. The fractal dimension was first introduced by Hausdorff in 1919, also known as the Hausdoff dimension [6]. Later, Mandelbrot generalized the fractional dimension to form fractal geometry.
Fractal dimension is a statistical measure that describes the complexity of a geometric shape. In more general terms, the fractal dimension describes how the shape changes in detail as the measurement scale changes [12].
In the previous section, it has been shown that the different morphology of copper electrodeposited in can be described by fractal geometry. In this section, our aim is to characterise the fractal dimension of these deposits for different electrolyte conditions in order to test for self-similarity. The fractal structure can be characterized by the equation
Where M(r) is the mass of the aggregate within the radius r and Df is the so-called fractal dimension [13].
For irregular shapes with the deposited copper fractals, the box counting dimension method is used to calculate the fractal dimension. The images are imported into imageJ to count the number of distinct sizes of grid (Box) occupied by the shapes. Then, the ratio of the number of grids to the corresponding grid proportions is calculated. Finally, a linear regression is performed to obtain the slope, which is the fractal dimension.
3.3.1 Growth time
Copper electrodeposited in an electrolyte consisting of 0.4 mol/L copper sulphate, 1 mol/L sulphuric acid, with an applied voltage of 12 V and electrolysis time ranging from 1 min to 6 min are shown in Fig. 4. The dendrites grow more intensively over a short period of time. As the reaction time increases, some of the dendrites stop expanding, new dendritic branches appear on the tips of the dendrites, the number of branches increases and the fractal character becomes clearer.
In Fig. 5, the fractal dimension of the dendrites gradually increases with increasing deposition time and then gradually stabilises. This means that after the initial growth and development of the copper fractal dendrites are complete. After approximately 4 min, then there are no significant changes in the fractal dimension.
3.3.2 Applied voltage
In order to explore the fractal growth pattern of copper dendrites electrodeposited at point electrodes. This paper investigates the effect of different growth conditions on the growth morphology and fractal dimension of dendrites during point electrode deposition.
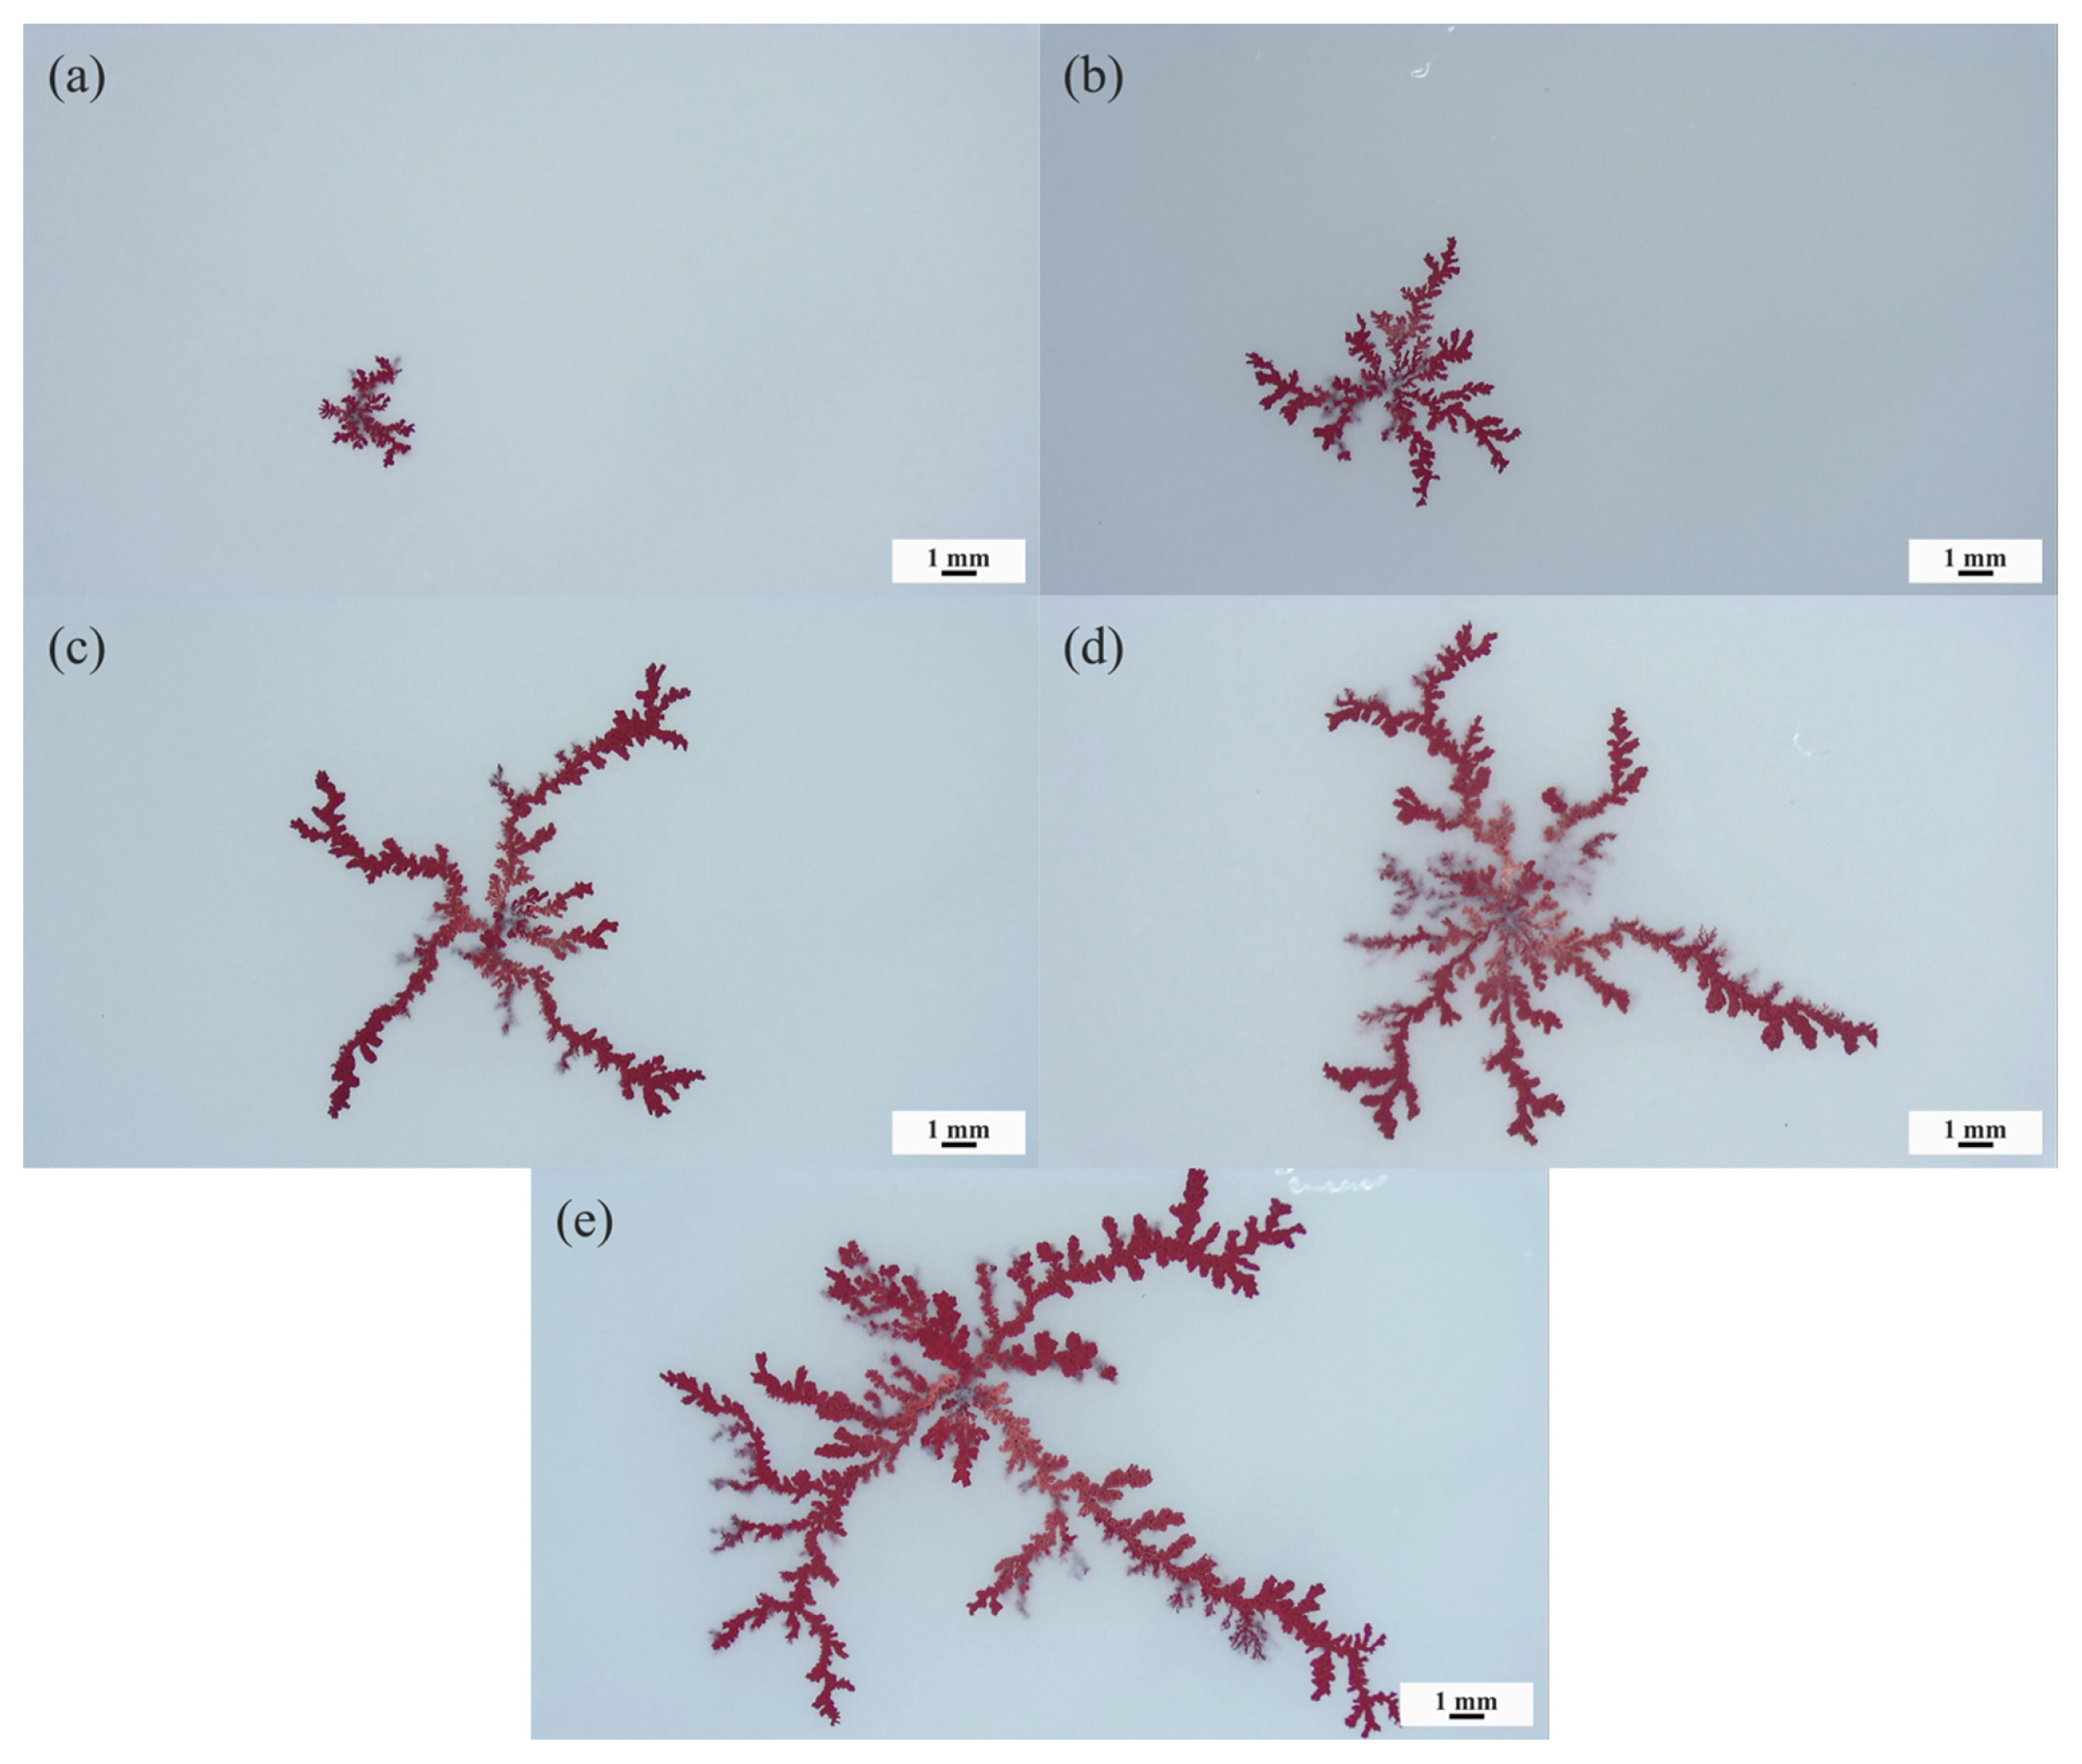
Fig. 6 shows the images of copper electrodeposition growth obtained by electrolysis of ring-shaped metallic copper anodes and cathode copper wires in an electrolyte consisting of 0.40 mol/L Cu2+, 1.00 mol/L H2SO4 with applied voltages of 3 V, 6 V, 9 V, 12 V and 15 V, respectively, for 4 min.
From Fig. 6a to 6e, it is found that the morphology of electrodeposited copper changes from denser, multi-branched growth to open, thick and short branched growth as the applied voltage between the cathode and anode increases. This is primarily due to the increase in current density, a greater probability of binding of free copper ions to electrons, an increase in the rate of nucleation, as well as of the increase of the hydrogen evolution [13].
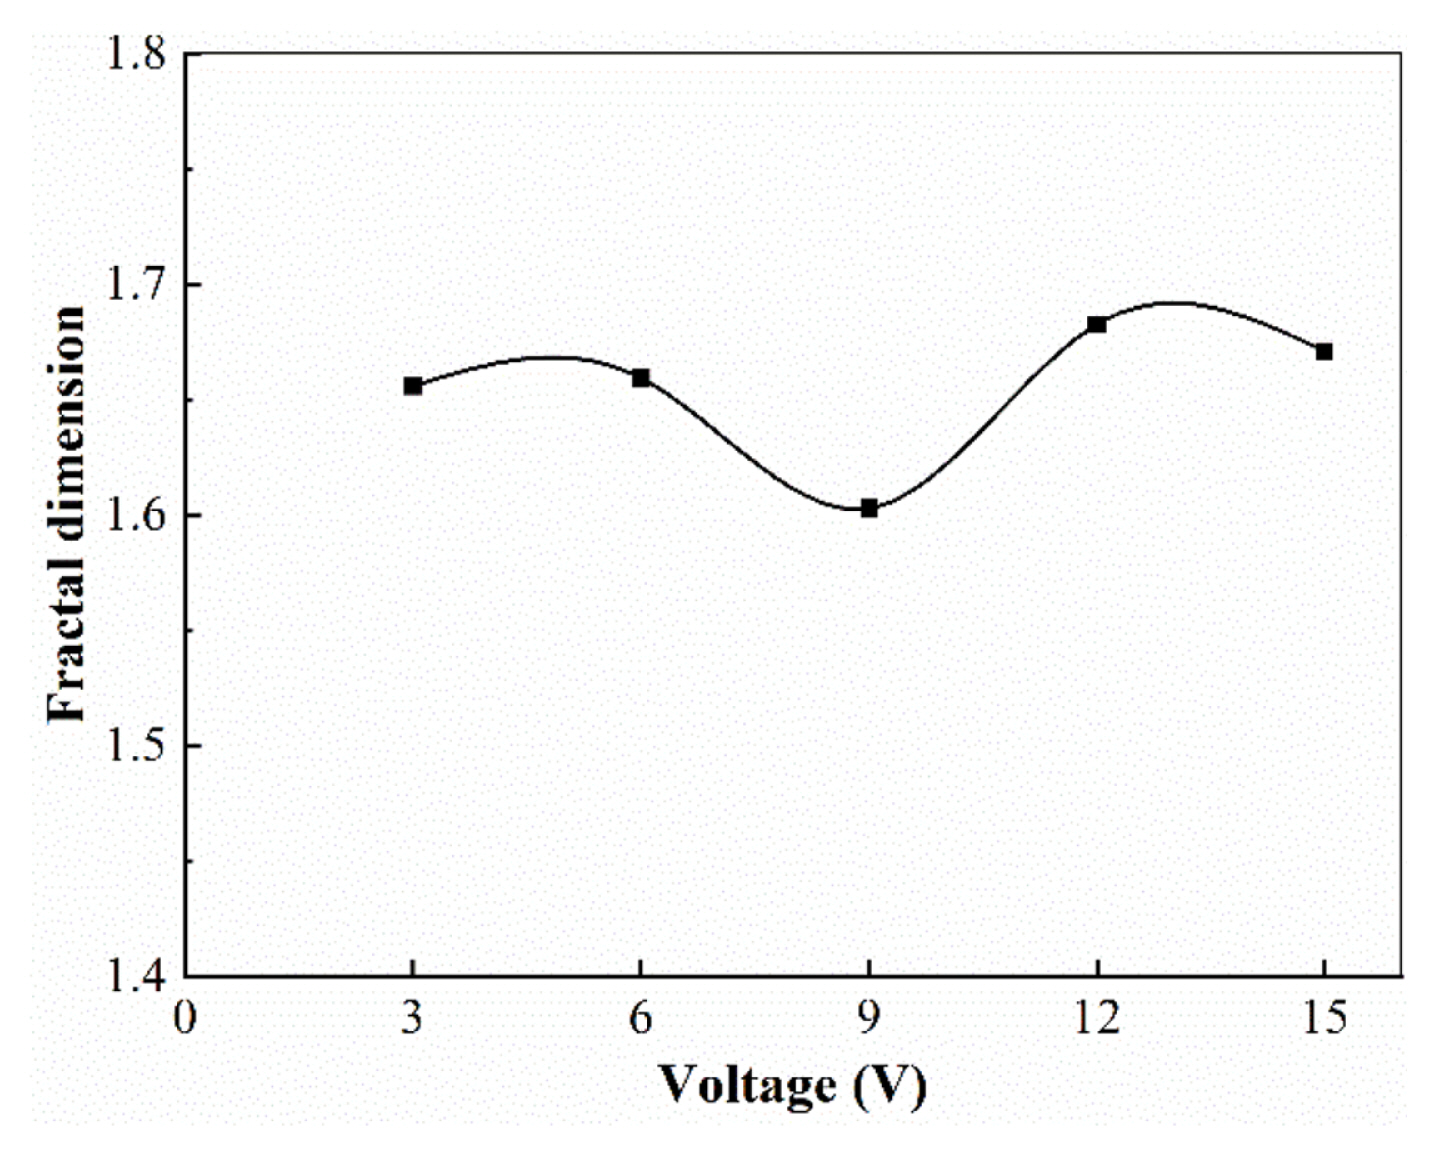
The fractal dimension of the electrodeposited products obtained at different applied voltages is shown in Fig. 7.
In the range of our experimental measurements, the fractal dimension of the electrodeposited product morphology varies irregularly with the applied voltage, with values fluctuating between 1.60 and 1.68, as showed in Fig. 4. The fractal dimension of the deposited copper morphology does not show a clear and regular trend with the applied voltage. Both M. Matsushita et al. [14] and C. P. Chen et al. [8] found fluctuations in the fractal dimension of Znic deposition products with the applied voltage in their respective studies of Znic electrodeposition products.
3.3.3 Concentration of copper ion
The diffusion of copper ions is the controlling aspect of the electrolytic copper powder process. In the electrodeposition of copper, to control the cathodic precipitation of electrodeposited copper metal powder form, we must ensure the Cu2+ concentration. However, the complexity and variability of the ions in the electrodeposition system make it difficult to control the instantaneous concentration of Cu2+. Therefore, in this stage, the effect of copper ion concentration parameters on the electrodeposited copper fractal morphology was investigated.
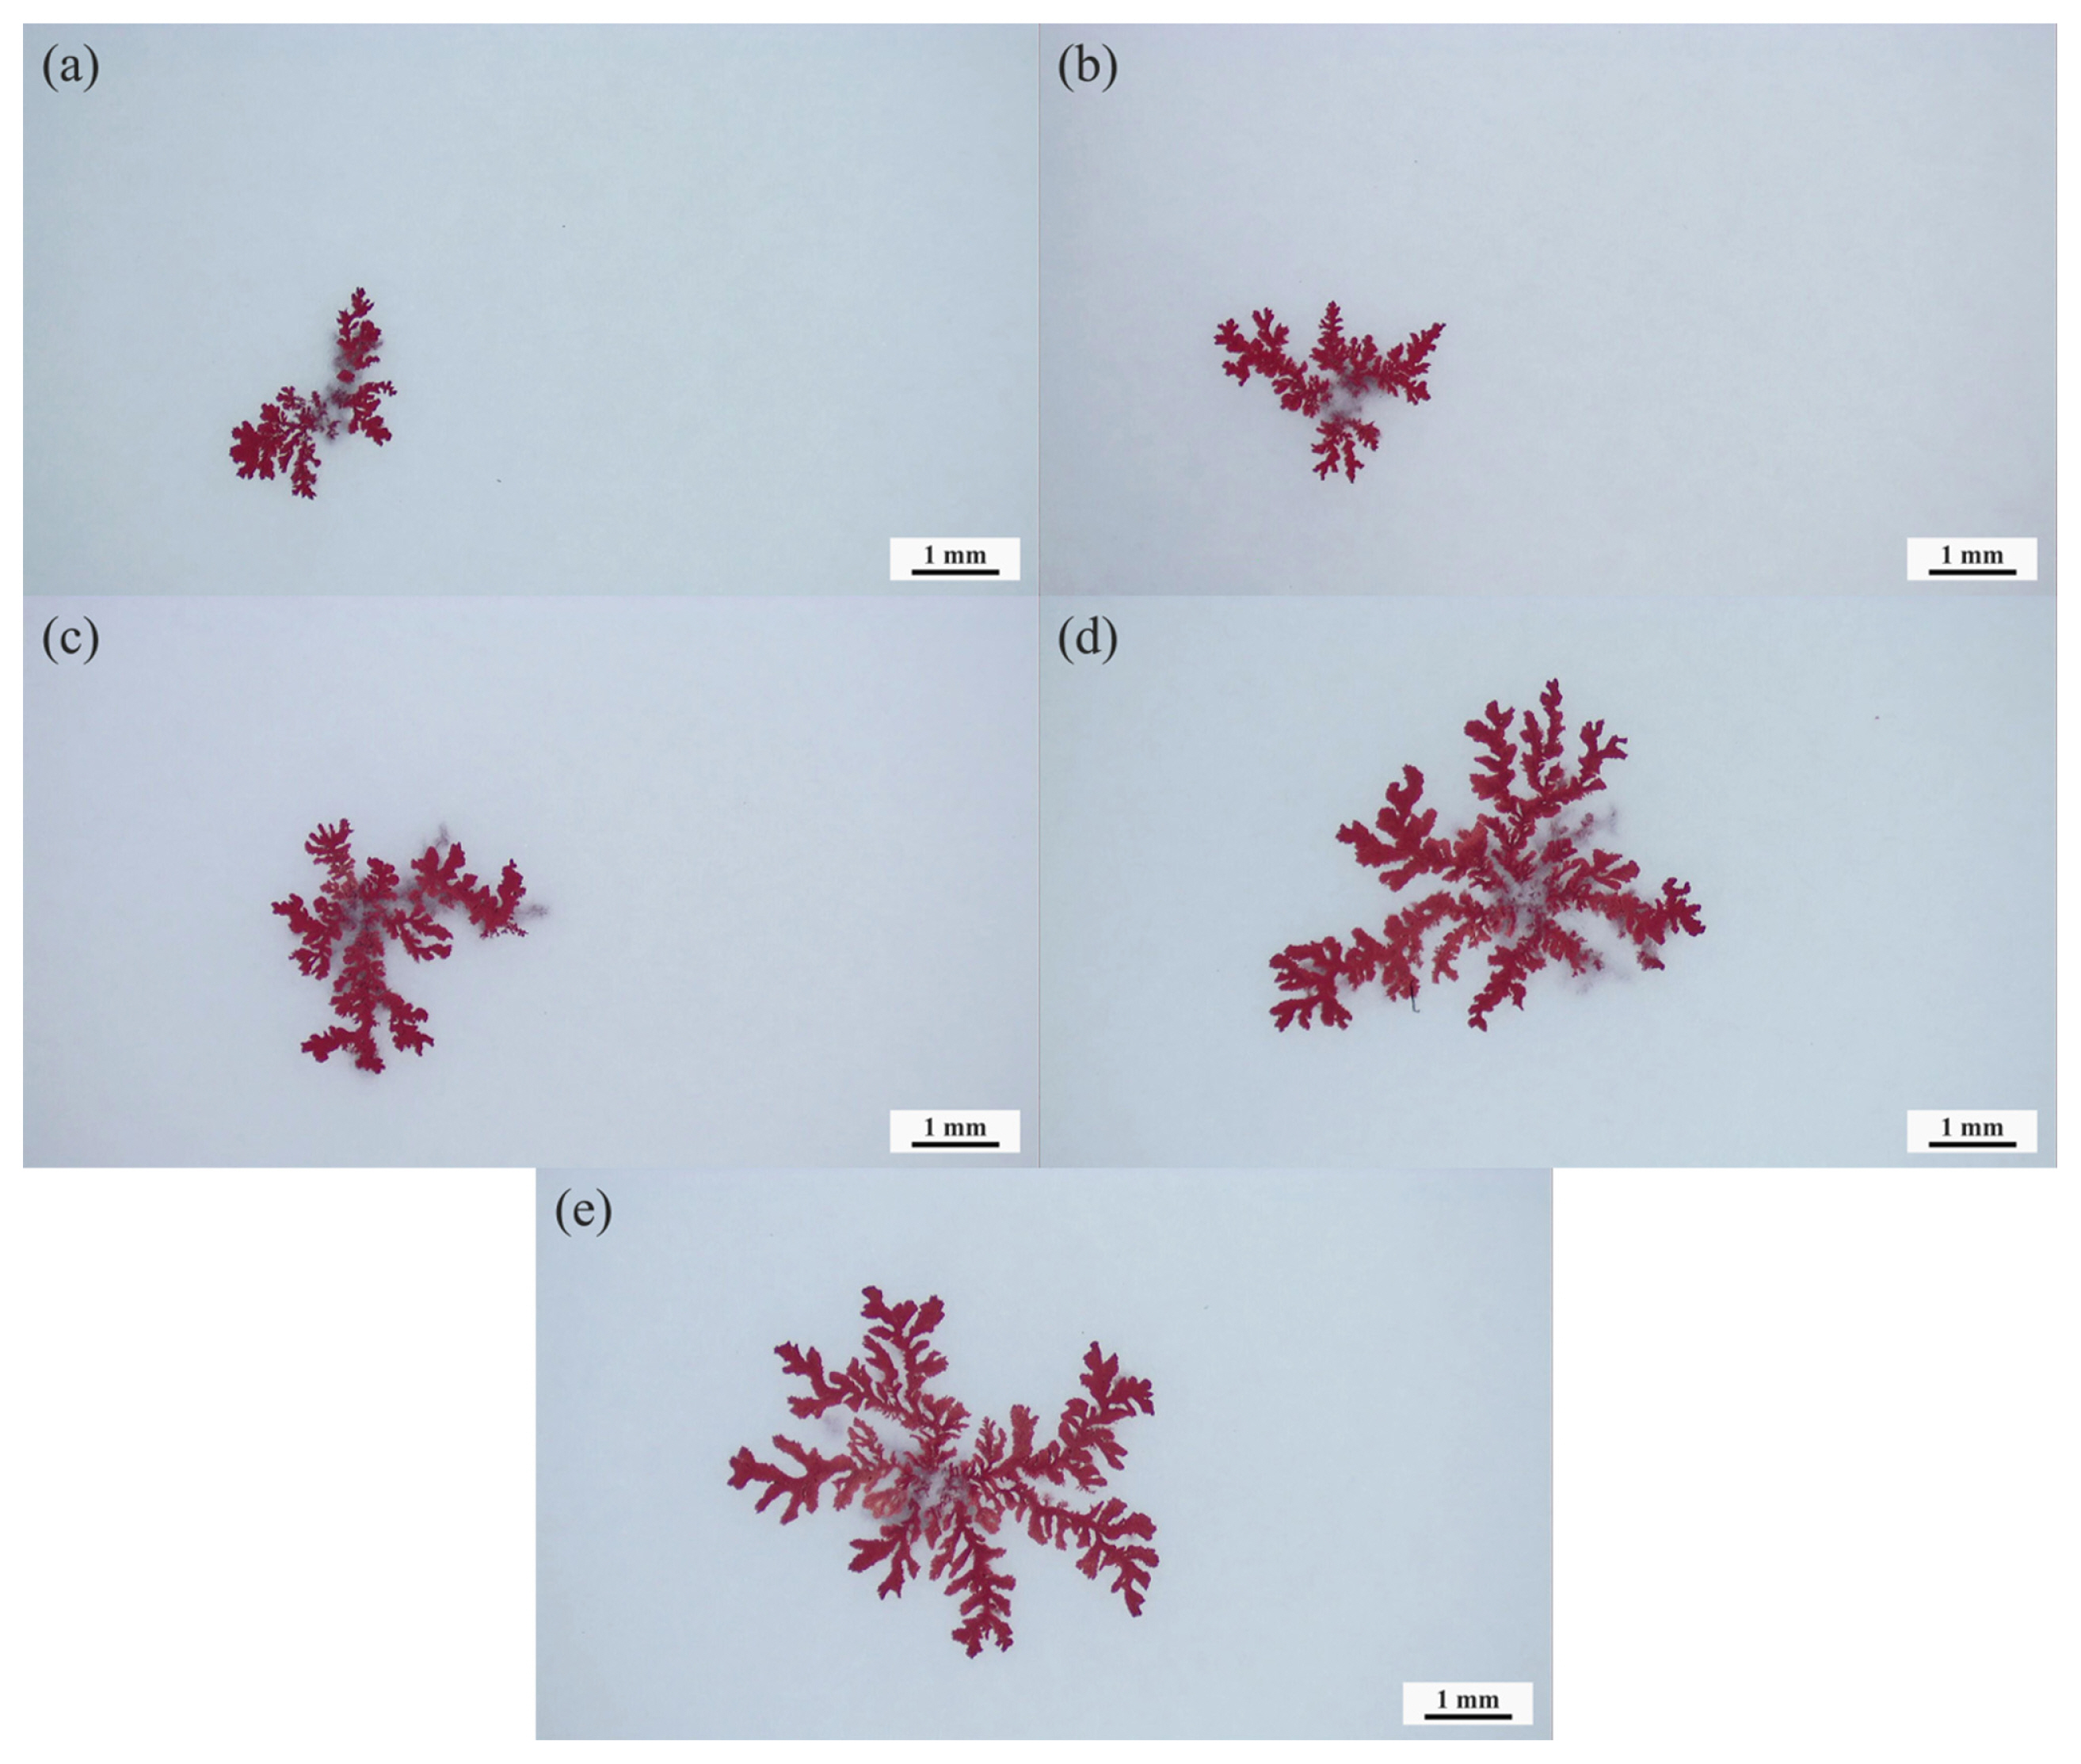
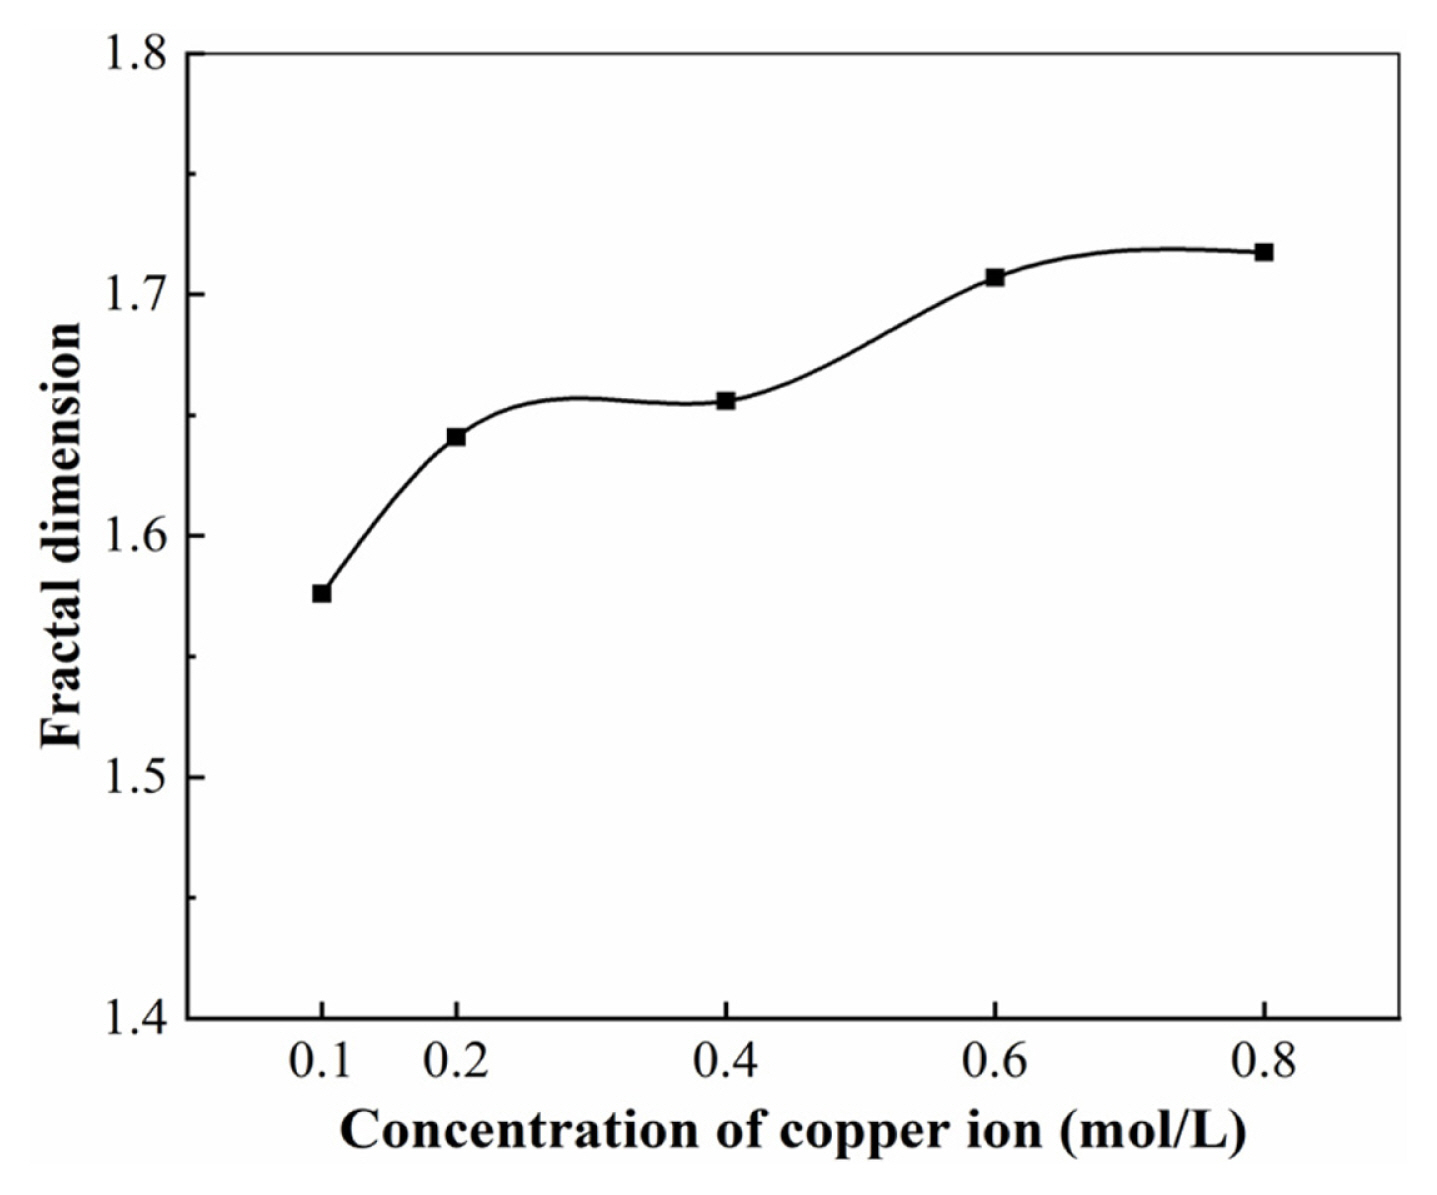
For all solutions, the values of applied voltage, electrolyte temperature and electrolysis time were kept constant at 6 V, 25°C and 4 min, respectively. The deposited copper morphology is depicted in Fig. 8. A comparison of the effect of different copper ion concentrations on the fractal dimensions of electrodeposited copper is shown in Fig. 9.
The morphology of the deposited copper products shows that as the concentration of copper sulphate increases, the morphology of the deposited products changes from a dense type consisting of shorter and finer branches to an open type consisting of thicker branches, which are gradually thicker and looser.
It is seen in Fig. 9 that the fractional dimensionality of the deposited copper products increases with the rise of concentration of copper ions in the electrolyte when other electrolytic conditions are kept constant. The cluster fractal structure arises because the fast-growing parts of the sediment branches shield other parts, making it harder for particles to reach the shielded parts. Thus, creating more branches of the product and forming a multi-branched fractal structure. Our analysis suggests that during the electrode-position of metallic copper, the substances in the electrolyte solution follow Brownian motion. The increased concentration of copper ions accelerates the deposition of copper ions near the cathode [15]. As the deposition rate of copper metal accelerates, the effect of inter-branch shielding is weakened and the chance of particles reaching the interior of the cluster is increased, so that the fractional dimension of the deposited product becomes larger as the concentration of copper sulphate increases; the branching of the deposited product also becomes more complex and coarse with the increase of copper sulphate concentration [16].
3.3.4 Concentration of H2SO4
In the previous two sections, it has been noted that the morphology of copper electrodeposited in thin electrolytes changes from dense to open dendritic structures as the applied voltage and electrolyte concentration increase and the fractal dimension fluctuates irregularly with the applied voltage and increases with the concentration of copper ions.
The movement of ions in the electrolyte is also accelerated when the applied voltage increases. However, as the cathodic electrodeposition of copper is accompanied by hydrogen precipitation side reactions, there may be fluctuations in the fractal dimension of the deposited product depending on the applied voltage and the electrolyte concentration.
Therefore, in this section we combine the results of the previous two sections in order to test the effect of sulphuric acid concentration (cathodic hydrogen precipitation side reaction) on electrodeposited copper morphology and fractal dimension.
For different acidity levels the thin electrolyte electrodeposited copper morphology is shown in Fig. 10, where the effect on DLA, dense radial and dendritic is illustrated.
Deposited copper the acidity levels of 0.01 mol/L, 0.05 mol/L and 0.10 mol/L was similar in shape. All showing a dense, neat dendritic shape with the secondary trunks being smaller than the primary trunks (Fig. 10a to 10c). This is probably due to the small acidity difference and the fact that the degree of hydrogen precipitation side reactions is close to each other. As the acidity increased to 0.25 mol/L (Fig. 10d), the sediment became more stoutly dendritic and the distinction between primary and secondary branches diminished. When the acidity was increased to 0.50 mol/L, the difference between the main body of the deposited copper morphology branches and the terminal branch morphology was evident. Our analysis suggests that this is an intermediate morphology that forms at critical values of acidity (Fig. 10e). We observed deposited copper at an acidity of 1.00 mol/L that was clearly distinct from the previous morphology (Fig. 10f). It is due to the violent precipitation of hydrogen that the branches are disrupted by the strong hydrogen flow, showing a short and coarse fractal structure and a thick deposit layer. For all deposits copper growth always tends to dominate in the direction of concentric circular electrodes.
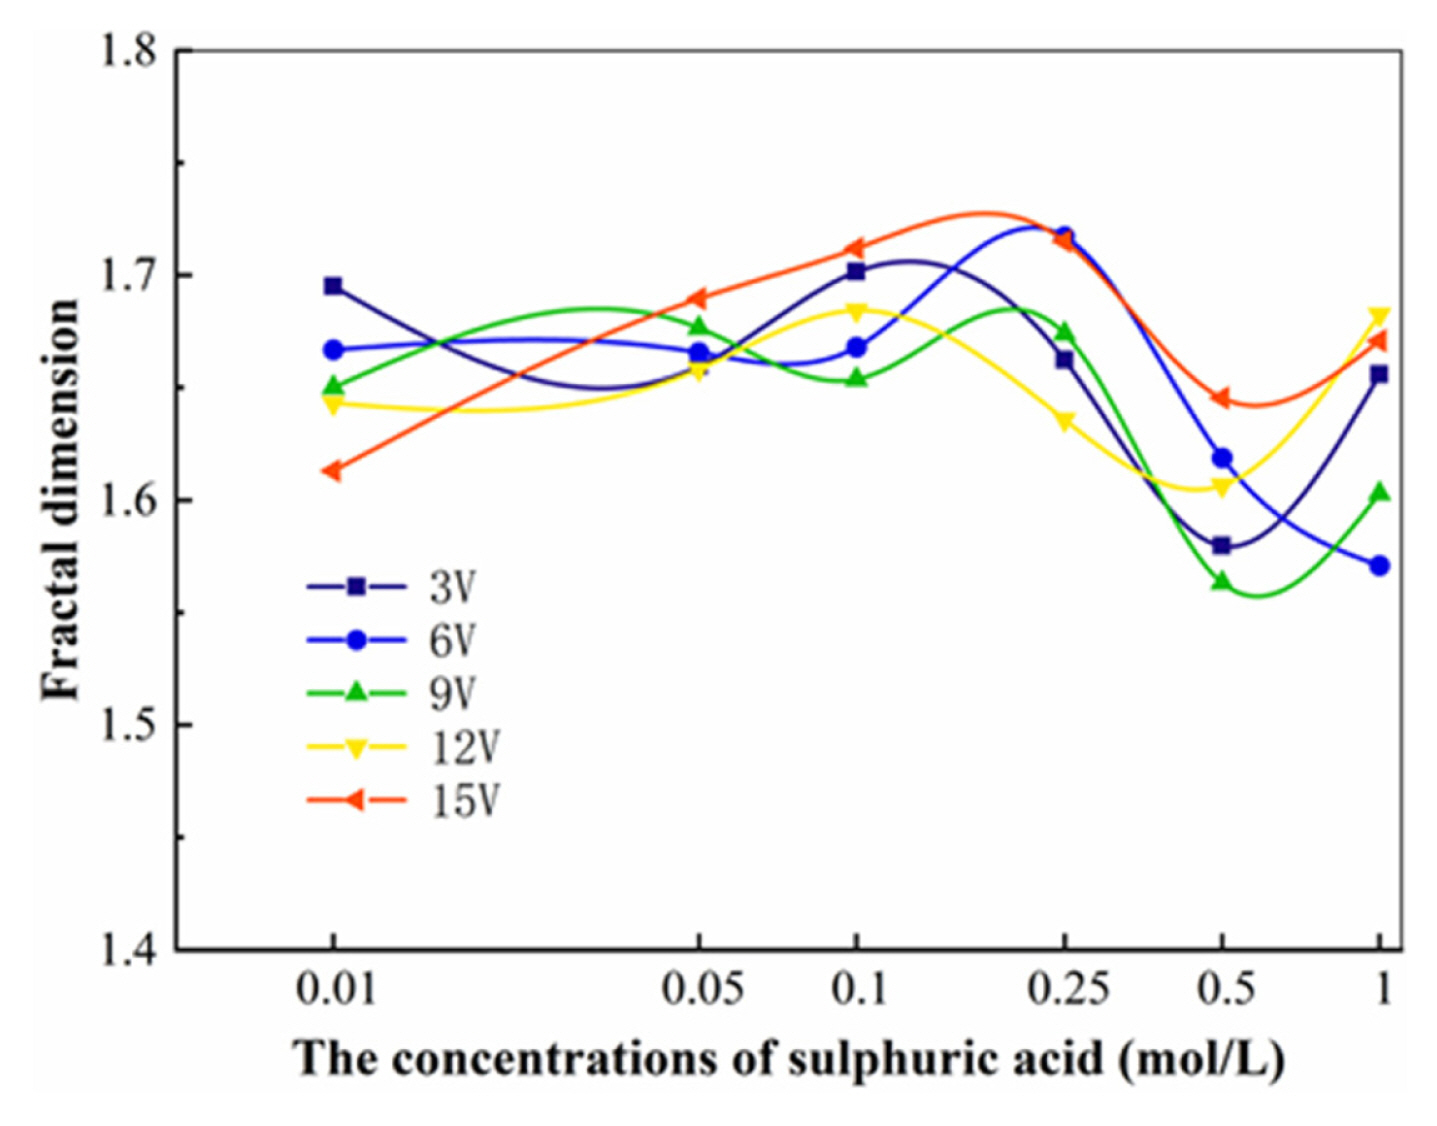
As showed in Fig. 11, the fractal dimension of the deposited copper dendrites shows a general trend of increasing and then decreasing with increasing sulphuric acid concentration.
Our analysis suggests that the fractal dimension of the electrodeposited copper products at higher applied voltages tends to increase strongly with increasing acidity in the electrolyte solution used, and is closely related to the intensity of the cathodic hydrogen precipitation reaction.
3.4. Integrated experiments
In the previous section, the fractal dimension was obtained for different open deposited copper at a fixed magnification (×30). Our results show that although there is little variation in the fractal dimension. The corresponding copper electrodeposition morphology varies significantly under different experimental conditions.
In this section we have taken video of a given deposit ((a) Cu2+ = 0.40 mol/L, H2SO4 = 0.01 mol/L, 12 V, 4 min; (b) Cu2+ = 0.40 mol/L, H2SO4 = 1.00 mol/L, 12 V, 4 min) growth process (see S1 and S2) and carried out morphological analysis at different magnifications (×30, ×90, ×200) (Fig. 9). At the same time, the fractal dimension of the different deposited copper was evaluated and the corresponding values were obtained (see Table 1).
This copper morphology can be denoted as “honeycomb-like” structure [17]. The basic characteristics of these morphologies are a large craters or holes which are a consequence of the attachment of the hydrogen bubbles.
Therefore, it is concluded that the copper electrodeposits morphology shows a DLA fractal with low acidity and intense hydrogen precipitation at high acidity, with hydrogen bubbles causing the fractal path to change to a sparse path shape as showed in S1. The dendritic detail becomes clearer with increasing magnification, and the fractal dimension has also tended to increase.
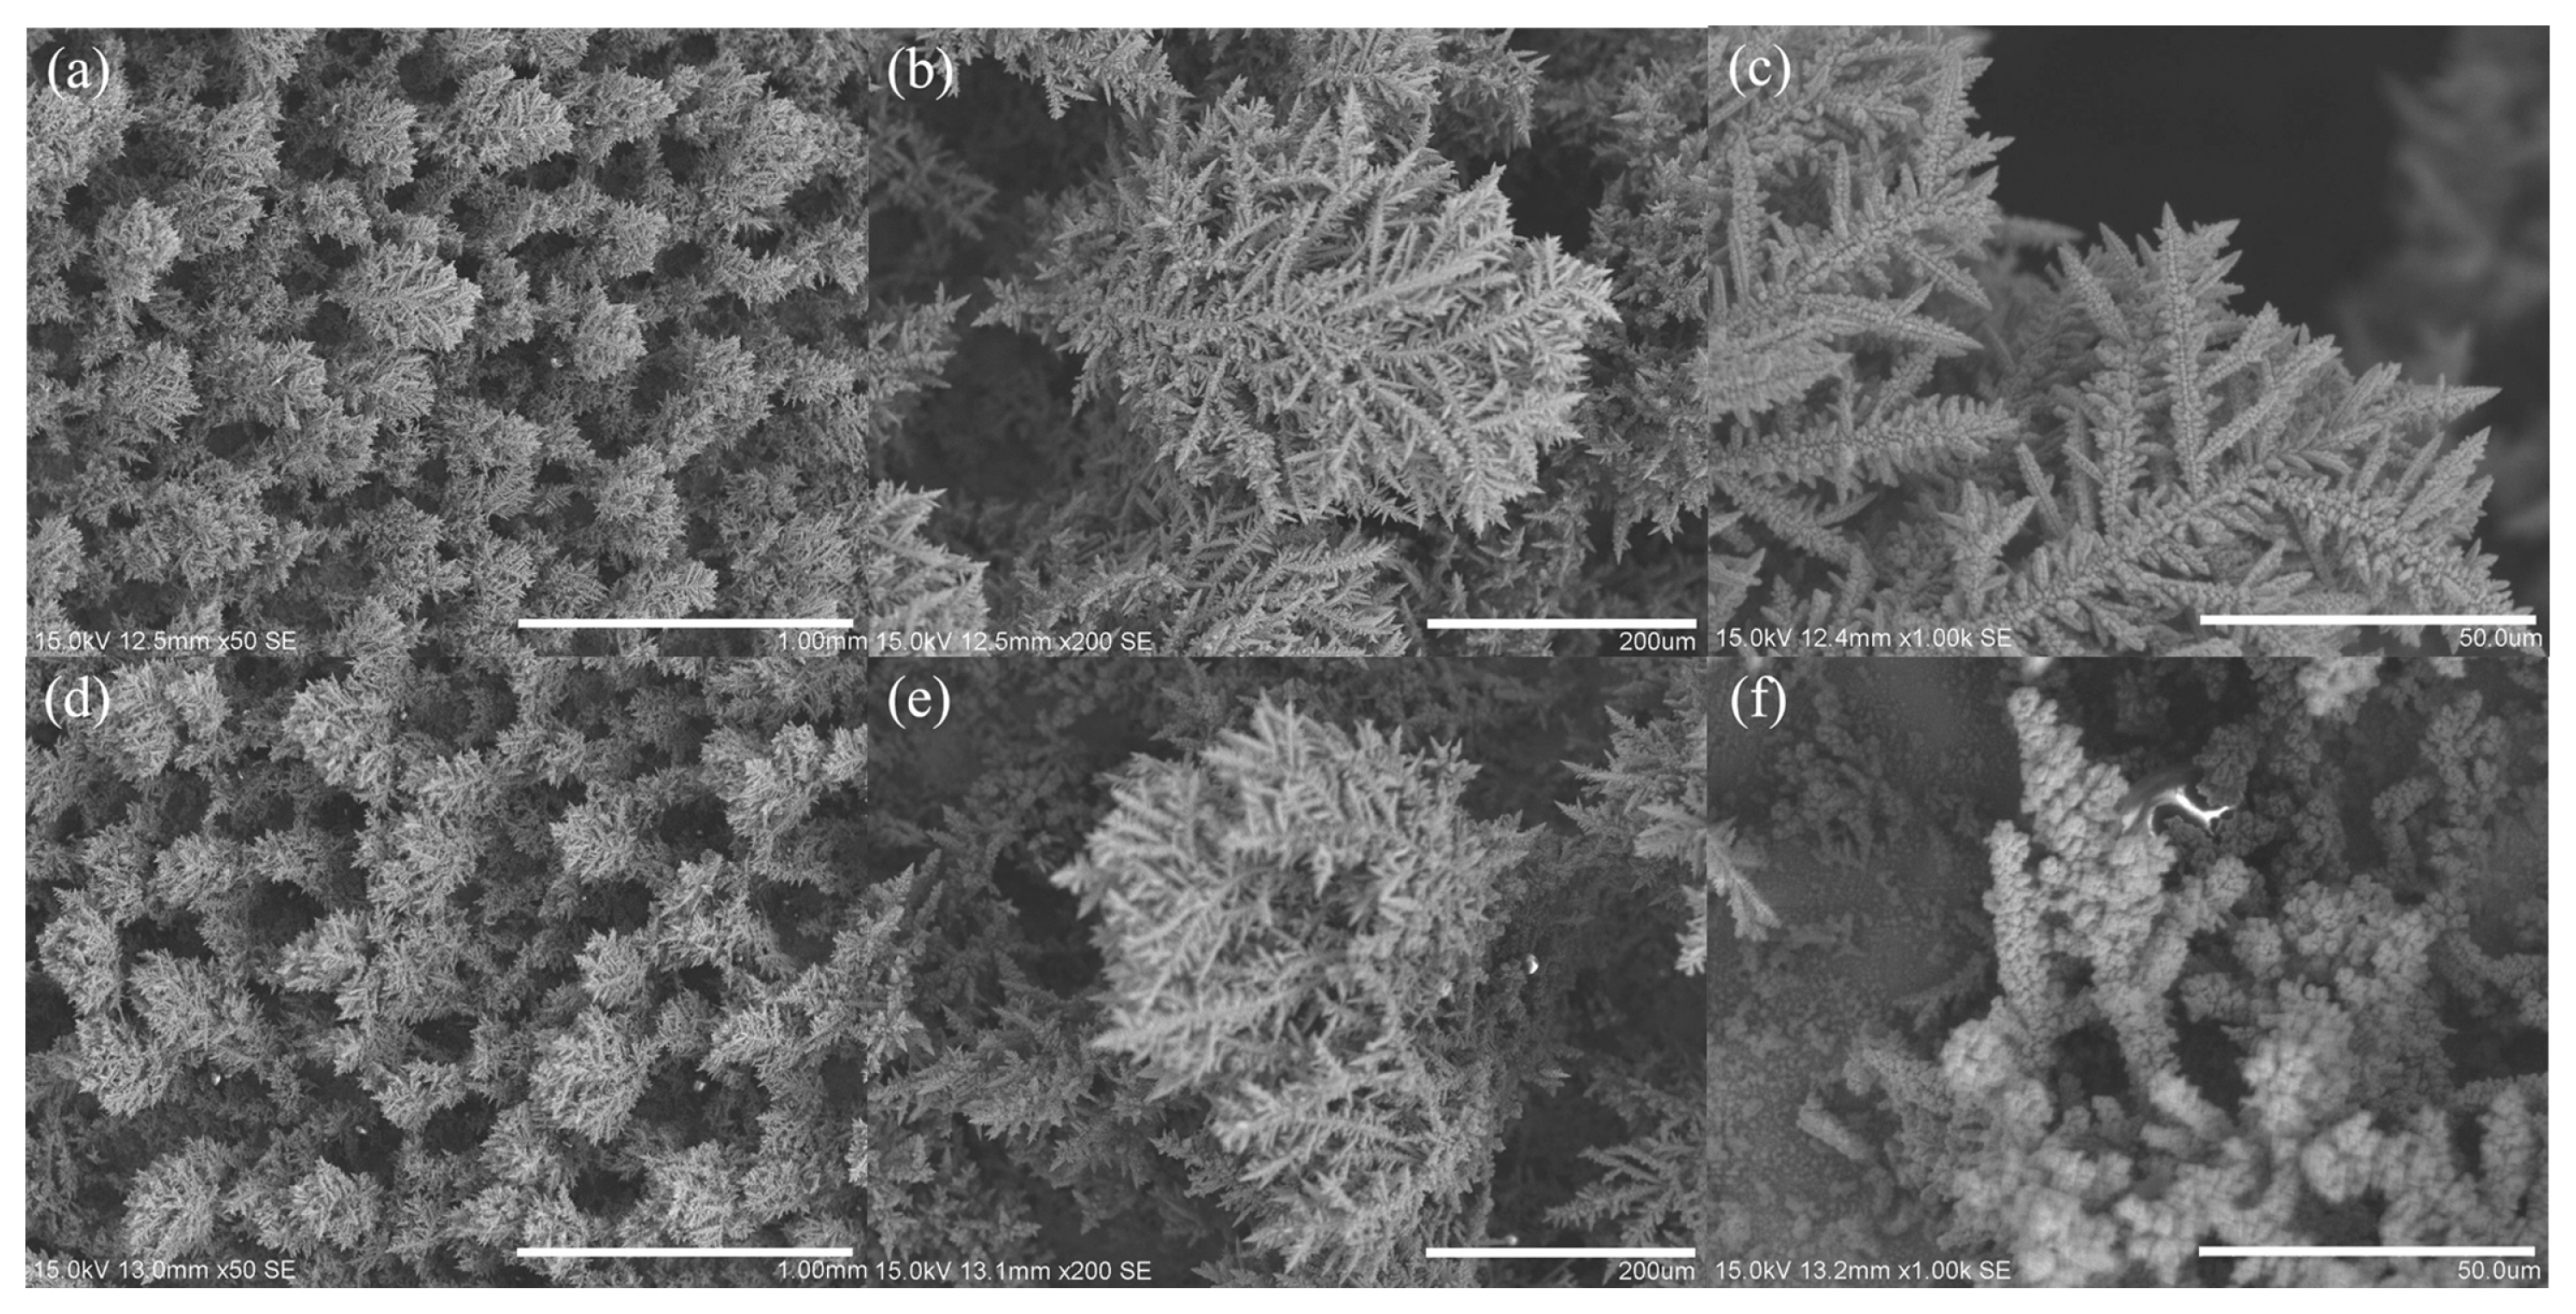
Fig. 13(a–c) show SEM micrographs of the electrodeposited copper powder on the copper cathode sheet obtained at a sulphuric acid concentration of 1 mol/L. The overall appearance is bushy, with dense pores distributed on the surface with a pore size of about 20 μm (a). Hydrogen aggregation and precipitation washes out to form dendritic aggregates of copper powder around the holes (c). Increasing the acidity from 1 mol/L to 1.5 mol/L led to an increase in the hydrogen precipitation reaction, as shown in Fig. 10(d–f). Although the overall appearance was still bushy, the uniformity decreased and the number of holes decreased and the pore size increased to approximately 50 μm (d). The dendritic structure of the terminal morphology of the copper powder aggregates around the pores degrades and changes to a cauliflower-like shape (f).
4. Conclusions
The growth mechanisms of electrodeposited copper under different conditions can be classified as: disordered dense, dense radial, dense dendritic and sparse dendritic. It is showed that with the increase of voltage and copper ion concentration, the deposited copper size becomes larger and its morphology changes from disordered dense on dendritic structure. The fractal dimension showed irregular fluctuations. The acidity was 0.01–0.25 mol/L and the deposited copper grew in circular geometry. The sediment morphology showed high similarity to the DLA cluster with fractal characteristics. The deposited copper morphology shifted to dendritic at an acidity of 0.50–1.00 mol/L. The main reasons were probably the increase of acidity leads to the intensification of hydrogen precipitation side reactions and the overflow path of hydrogen bubbles affects the growth of electrodeposited copper dendrite fractals.