


1. Introduction
Durable electrocatalysts are necessary for the practical application of polymer electrolyte membrane fuel cells (PEMFCs). As the cathode electrocatalysts in these devices are exposed to highly oxidative conditions stemming from the electrode potential and the presence of oxygen and water, transition metals and even noble metals such as Pt in the electrocatalysts deteriorate during PEMFC operation [1]. In PEMFCs, Pt-based electrocatalysts are degraded mainly by dissolution, agglomeration, and detachment of Pt during operation [1]. These processes diminish the number of active sites available for the cathodic reaction, i.e., the oxygen reduction reaction (ORR), and thereby degrade the PEMFC performance.
To overcome electrocatalyst degradation due to Pt dissolution, alloying the electrocatalyst with transition metals possessing high enthalpies of alloy formation (ΔHf), such as Y, Sc, Zr, and Ti, has been suggested [2,3]. As the strong bonding between Pt and the transition metals hinders the removal of Pt atoms from the alloyed crystals, dissolution of Pt is expected to be suppressed when it is alloyed with transition metals having high ΔHf values. To illustrate this, Yoo et al. reported the preparation of thin film alloys using a sputtering technique and demonstrated that Pt alloys with Y, Zr, and Ti were resistant to degradation under ORR conditions [3-5]. However, in practical terms, Pt alloys with Y, Sc, or Zr cannot be utilized for application to a PEMFC cathode, as nanoparticles of Pt alloys with Y, Sc, or Zr have not been reported, and their thin films have been produced only using physical vapor deposition techniques [3-5]. To achieve both a high surface area and good electrocatalyst stability, the PEMFC cathode requires nanoparticles deposited on high-surface-area carbon supports [e.g., carbon-supported platinum nanoparticles (Pt/C)].
Among the various alloy nanoparticle catalysts, carbon-supported ordered Pt-Ti alloy nanoparticles could be a promising and realizable candidate. As the intermetallic ordered structure of Pt alloy nanoparticles has been reported to enhance their durability, mainly because of diminished transition metal dissolution [6-11], ordered Pt-Ti alloy nanoparticles have been expected to show higher durability than disordered Pt-Ti alloy nanoparticles. A few groups have reported that carbon-supported ordered Pt-Ti alloy nanoparticles could be prepared via wet chemical approaches, unlike Pt alloys with Y, Sc, or Zr [12,13]. Ti3+ can be reduced by strong reducing agents such as sodium naphthalenide [14] and potassium triethylborohydride [15]. The DiSalvo group prepared ordered Pt3Ti alloy nanoparticles by a thermal annealing step at 700┬░C in a KCl matrix before depositing them onto carbon supports [15]. Ding et al. prepared carbonsupported ordered Pt3Ti nanoparticles by decomposing Pt and Ti salts deposited onto carbon supports at 850 and 950┬░C under a H2/N2 (1:10 v/v) atmosphere [16]. However, the ORR stability and activity of ordered Pt-Ti alloys have not been reported in the literature, although the ORR activity of disordered Pt-Ti alloys was reported in [16]. Thus, to further demonstrate the potential of ordered Pt-Ti alloy nanoparticle electrocatalysts as PEMFC electrode materials, investigations of their stability are required.
Here, we report the preparation of carbon-supported ordered Pt-Ti alloy nanoparticle electrocatalysts and their high durability for the ORR. The electrocatalysts were prepared using the wet chemical reduction of Pt and Ti precursors and subsequent heat treatment. The structural ordering of the Pt-Ti particle electrocatalysts was confirmed using X-ray diffraction (XRD), and the morphology of the nanoparticles was investigated using transmission electron microscopy (TEM). Finally, the activity and stability of the electrocatalysts were evaluated using ORR polarization curves, which were recorded using a rotating disk electrode (RDE) system.
2. Experimental Section
2.1. Preparation of Electrocatalysts
Carbon-supported Pt-Ti alloy (20 wt%) or Pt electrocatalysts were prepared by reducing the metal salts in a carbon dispersion of anhydrous tetrahydrofuran (THF) before heat treatment at 800┬░C (Fig. 1). As Ti is sensitive to oxygen and moisture, all processes were conducted under an Ar atmosphere (99.999%) using a glove box and standard Schlenk techniques. In the glove box, carbon black (0.05 g, Vulcan XC-72, Cabot), which was dried in a vacuum oven (80┬░C), was dispersed in anhydrous THF (200 mL, Sigma-Aldrich). The Pt precursor, dichloro(dicyclopentadienyl)platinum(II) (Sigma-Aldrich), and the Ti precursor, titanium(III) chloride tetrahydrofuran complex [TiCl3-3(THF), Sigma-Aldrich], were then added to the dispersion. In this procedure, three Ti molar compositions (Ti:Ti+Pt) were utilized: 0, 0.25, and 0.4 to 1. With vigorous stirring, 20 mL of 1 M superhydride (lithium triethylborohydride, Sigma-Aldrich) solution in THF was injected into the mixture, followed by gentle stirring for 12 h. Then, 20 mL of anhydrous methanol was introduced to the suspension, and the suspension was left to settle. The collected precipitate was washed with copious amounts of anhydrous methanol and ethanol prior to drying under an Ar atmosphere. The samples prepared are denoted using the molar composition of Ti:Ti+Pt, where a-Pt, a-PtTi25, and a-PtTi40 refer to molar compositions of 0, 0.25, and 0.40 to 1, respectively. Portions of the as-prepared samples were then heat-treated at 800┬░C under an Ar atmosphere for 2 h and are denoted according to the nominal molar composition of Ti:Ti+Pt as Pt, PtTi25, and PtTi40. A commercial 20 wt% Pt/C (Johnson Matthey) electrocatalyst was utilized as the comparison sample.

2.2. Characterization of Electrocatalysts
XRD was conducted using a D-MAX2500 diffractometer (Rigaku Corp.). The diffractometer was operated with a Cu K╬▒ source (l = 1.541 ├ģ) at 40 kV and 200 mA. TEM images of the electrocatalysts were taken with a JEM-2010 transmission electron microscope (JEOL) or a TecnaiTM transmission electron microscope (FEI).
2.3. Electrochemical measurements
All electrochemical measurements were performed in a conventional three-electrode configuration using an RDE (Eco Chemie) and an AUTOLAB PGSTAT 20 potentiostat (Eco Chemie). The temperature of the electrolyte was controlled at 20 ┬▒ 0.5┬║C using a thermostat bath. A saturated calomel electrode (Hanna Instruments) was used as the reference electrode experimentally; however, all potentials are quoted with respect to the normal hydrogen electrode (NHE). A glassy carbon rod served as the counter electrode. To prepare the electrocatalyst-coated RDE (working electrode), 10 mg of the electrocatalyst was dispersed in a mixture of Nafion┬« solution (100 ╬╝L) and 1,2-propanol (1 mL). The suspension was deposited on the glassy carbon disk (diameter, 5 mm) of the RDE using a micropipette and dried under air. ORR polarization curves were recorded in an O2-saturated 0.1 M HClO4 electrolyte at a scan rate of 5 mV sŌłÆ1 and an RDE rotation speed of 1600 rpm. Cyclic voltammetry (CV) was conducted in an Ar-saturated 0.1 M HClO4 electrolyte at a scan rate of 20 mV sŌłÆ1. To evaluate the durability of the electrocatalysts, ORR polarization and CV curves were recorded before and after 1500 potential cycles between 0.6 and 1.1 V in an O2-saturated 0.1 M HClO4 electrolyte (accelerated durability test, ADT).
3. Results and Discussion
Fig. 2 shows TEM images of the as-synthesized samples (a-c) and heat-treated electrocatalysts (d-f). The images of the as-synthesized samples (a-Pt, a-PtTi25, and a-PtTi40) show highly dispersed particles on carbon supports with particle sizes of approximately 2-3 nm. The small size of the particles may be attributed to the strong reducing power of superhydride [17], which causes particle nucleation to proceed more rapidly than particle growth [18]. The TEM images also demonstrate that the heat treatment enlarged the particles owing to sintering and agglomeration (Fig. 2d-f). The PtTi40 sample showed large but fairly uniformly sized particles of approximately 10 nm. The Pt and PtTi25 samples showed uneven size distributions, with large particles exhibiting lengths on the order of tens of nanometers, whereas the smaller particles had diameters of a few nanometers.
Fig.┬Ā2.
TEM images of as-prepared carbon-supported nanoparticles (aŌĆōc) and heat-treated electrocatalysts (d-f): (a) a-Pt, (b) a-PtTi25, (c) a-PtTi40, (d) Pt, (e) PtTi25, and (f) PtTi40.

The crystalline structures of the electrocatalyst solids were analyzed using XRD (Fig. 3). The XRD patterns of the Pt sample matched well that of pure Pt (JCPDS #: 65-2896), where peaks at 39.79┬░, 46.24┬░, and 67.48┬░ are attributed to (111), (200), and (220) plane diffractions, respectively. PtTi25 showed diffraction peaks at 15.23┬░, 21.43┬░, 25.11┬░, 30.47┬░, 33.49┬░, 39.91┬░, 46.42┬░, and 67.77┬░, which correspond to the (110), (200), (101), (220), overlapped (211) and (310), (301), overlapped (330) and (002), and overlapped (600) and (332) diffractions, respectively, of Pt8Ti (JCPDS#: 65-8378). The small peaks between the (002) and (600) diffraction peaks were difficult to observe in the XRD patterns because of their low relative intensity [<1% compared to that of (301) diffraction]. The XRD patterns of the PtTi40 sample exhibited diffraction peaks at 32.38┬░, 39.91┬░, 46.41┬░, and 67.76┬░, which were assigned to the (110), (111), (200), and (220) plane diffractions, respectively, of the Pt3Ti crystal (JCPDS#: 65-3259). A broad peak at around 24┬░ was attributed to superposition of the (100) plane diffraction of Pt3Ti (22.80┬░) and the (002) plane diffraction of graphite (PDF#: 65-6221) from the carbon support. The (210) and (211) diffractions of Pt3Ti (52.46┬░ and 57.92┬░, respectively) were also difficult to observe in the XRD patterns owing to their low relative intensities [6.5% and 4.7%, respectively, of that of (111) diffraction].
Fig.┬Ā3.
XRD patterns for (a) Pt, (b) PtTi25, and (c) PtTi40. Red bars in the graph indicate diffraction angles of the corresponding reference crystals.

The XRD analyses confirmed that ordered Pt/Ti alloys were prepared in the PtTi25 (Pt8Ti) and PtTi40 (Pt3Ti) samples. The crystal sizes of the PtŌĆōTi alloy and Pt particles were calculated from the line broadening of the (220) diffraction peak (PtTi40 and Pt) and (301) diffraction peak (PtTi25), and were found to be 18.5, 13.4, and 7.9 nm for Pt, PtTi25, and PtTi40, respectively. These data demonstrate that the samples with higher Ti composition had smaller crystal sizes. This is likely because Pt, when alloyed with Ti, has a high enthalpy of alloy formation (╬öHf = ŌłÆ0.8 eV) for Pt3Ti [2] compared to that of pure Pt, and thus, alloying with Ti would restrain nanoparticle growth during the heat treatment
To evaluate the activity and durability of the prepared electrocatalysts, ORR polarization curves were recorded before and after 1500 electrochemical cycles between 0.6 and 1.1 V (the ADT) in 0.1 M HClO4 (Fig. 4). The Pt sample elicited a positive potential shift of the ORR polarization curve after the ADT experiments (Fig. 4a), suggesting improved activity. This could be explained by the increased surface area of the electrocatalysts, which is likely due to surface roughening of large Pt particles [7]. Conversely, the ORR polarization curves of PtTi25 (Fig. 4b) and PtTi40 (Fig. 4c) were affected very little by the ADT process, and the ORR polarization curves of the disordered alloy electrocatalyst (a-PtTi40) (Fig. 4d) and a commercial Pt/C electrocatalyst (Fig. 4e) were shifted to more negative potentials following the ADT process, indicating degradation of the electrocatalyst. The small change in the diffusion-limiting currents after the ADT process implied marginal changes in the geometric area of the electrocatalyst coating layers.
Fig.┬Ā4.
ORR polarization curves of (a) Pt, (b) PtTi25, (c) PtTi40, (d) a-PtTi40, and (e) commercial Pt/C (Pt-JM) before (black) and after (red) the ADT.

Fig. 5 compares the half-wave potentials (E1/2) of the ORR polarization curves before (black) and after (red) the ADT process. Before the ADT, the measured E1/2 values had the following order: commercial Pt/C (0.859 V) > PtTi40 (0.849 V) > a-PtTi40 (0.847) > PtTi25 (0.810 V) = Pt (0.810 V). The lower ORR activity of PtTi40 compared to that of commercial Pt/C is likely due to the larger particle size (~10 nm) of the former compared to that of commercial Pt/C electrocatalysts (Pt-JM) (~3-4 nm). This agrees with the work of Ding et al., who reported a positive E1/2 shift of +20 mV for Pt75Ti25/C electrocatalysts with an average particle size of 2.7 nm compared with that of commercial Pt/C electrocatalysts [16]. The similar E1/2 values of PtTi40 and a-PtTi40 despite the larger particle size of PtTi40 (~10 nm) compared to that of a-PtTi40 (2-3 nm) implied higher activity of surface Pt atoms in PtTi40 than in a-PtTi40.
Fig.┬Ā5.
Half-wave potentials (E1/2) of Pt, PtTi25, PtTi40, a-PtTi40, and Pt-JM before (black) and after (red) the ADT, as derived from ORR polarization curves.
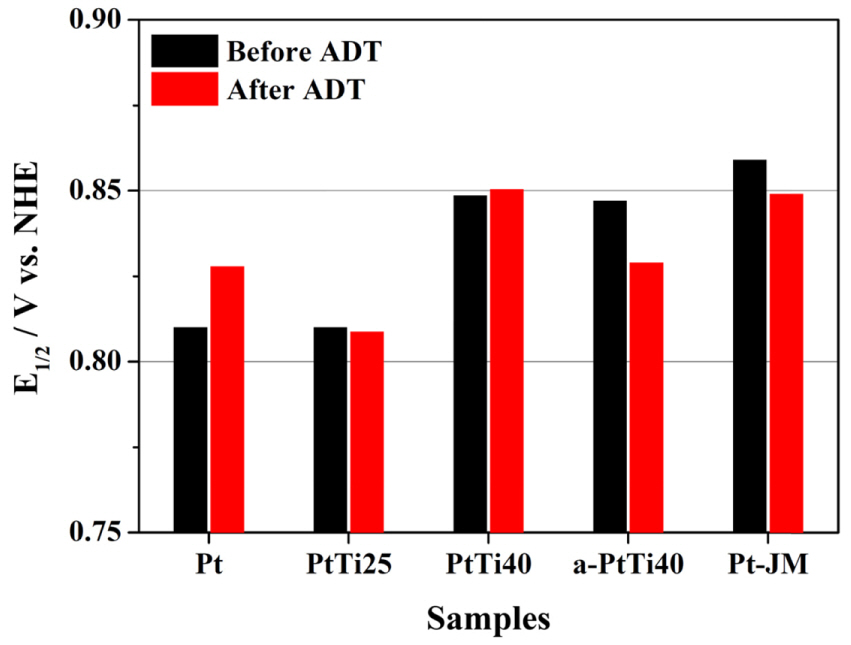
After the ADT experiment, the E1/2 values of PtTi40 changed very little (+1 mV), indicating its high stability. Conversely, the E1/2 values observed for Pt-JM and a-PtTi40 exhibited negative potential shifts of 10 and 18 mV, respectively (Fig. 5). Overall, the E1/2 values of the studied electrocatalysts following the ADT experiments were observed to follow the order PtTi40 (0.850 V) > Pt-JM (0.849 V) > a-PtTi40 (0.829) > Pt (0.828 V) > PtTi25 (0.809 V). The PtTi25 sample showed little change in E1/2 following the ADT experiments, indicating high electrocatalyst stability; however, it did not perform as well as PtTi40 and Pt did.
Fig. 6a shows the Tafel plot of PtTi40 before and after the ADT at a potential of around 0.9 V vs. NHE. The Tafel slope of PtTi40 exhibited little change (64 mV decŌłÆ1 before ADT and 60 mV decŌłÆ1 after ADT) and corresponds well with that of polycrystalline Pt surfaces in low overpotential regions (~60 mV decŌłÆ1) [19]. The Tafel slope of the Pt, PtTi25, PtTi40, a-PtTi40, and Pt-JM samples were all close to 60 mV decŌłÆ1, and they exhibited only a marginal change during the ADT (Fig. 6b). The minimal changes in the Tafel slope following the ADT experiments implied that the reaction mechanism at the electrocatalyst surface changed very little. Considering the Tafel equation, dE/dlog(i) = 2.3RT/╬▒F (where E is the electrode potential, i is the current, R is the gas constant, T is the temperature, ╬▒ is the apparent transfer coefficient, and F is the Faraday constant), we can see that a Tafel slope of ~60 mV decŌłÆ1 indicates an ╬▒ value of ~1. This result is considered to originate from the high coverage of oxygen species such as -OH, -OOH, and -O at the Pt surface; however, the microkinetic models controlling the Tafel slope have not been conclusively determined [19-21].
Fig.┬Ā6.
Tafel data: (a) Tafel plot of PtTi40 and (b) Tafel slope of the electrocatalysts before (black) and after (red) the ADT.

The cyclic voltammograms of the electrocatalysts were recorded before and after the ADT and are shown in Fig. 7. An increased adsorption/desorption charge of underpotentially deposited hydrogen (Hupd) was observed for the PtTi40 sample after the ADT. This can be explained by the increased number of Pt atoms exposed on the particle surfaces, likely owing to surface roughening [7] and/or removal of surface TiOx, thus blocking the alloy particle surfaces. Pt3Ti(111) surfaces have been reported to produce surface TiOx layers, even at low partial pressures of oxygen (10ŌłÆ5-10ŌłÆ8 mbar) at elevated temperatures (900-1000 K) [22]. Thus, we consider that the surfaces of PtTi25 and PtTi40 were covered by TiOx at the beginning of the ADT and that removal of the surface TiOx during the ADT increased the number of available Pt atoms.
Fig.┬Ā7.
Cyclic voltammograms of (a) Pt, (b) PtTi25, (c) PtTi40, and (d) Pt-JM before (black) and after (red) the ADT.

Considering the small change in E1/2 observed in the ORR polarization curve after the ADT, the suppressed ORR activity per Pt atom implies increased exposure of the Pt atoms at the surface. As surface roughening increases the fraction of low coordination sites (which possess significantly lower ORR activity per Pt atom [23]), it can be said to suppress the electrocatalyst activity on a per-atom basis. PtTi25 also showed similar behavior to that of PtTi40, with an increase in the Hupd charge and little change in the ORR polarization curve. In contrast, the Hupd charge of Pt-JM decreased by 24.9% (Fig. 7d) after the ADT, in accordance with the negative potential shift of the ORR polarization curve. The decreased Hupd charge was attributed to dissolution and/or agglomeration of small Pt nanoparticles [24], implying a decreased Pt surface area. For the Pt sample, the Hupd charge increased, and the polarization curve shifted to positive potentials following the ADT experiment. These results suggest that the ORR activity of the Pt sample after the ADT experiment was affected more significantly by the increased Pt atom exposure than by the diminished specific activity induced by surface roughening.
4. Conclusion
Carbon-supported Pt-Ti alloy electrocatalysts (PtTi25 and PtTi40) were prepared as durable and efficient ORR electrocatalysts by wet chemical reduction of Pt and Ti salts with various Ti atomic compositions, followed by heat treatment. Two ordered Pt-Ti alloy structures were confirmed by XRD analyses: Pt8Ti for PtTi25 and Pt3Ti for PtTi40. The ORR activity was evaluated using the E1/2 values and was not significantly degraded in the PtTi40 sample by the ADT process. Conversely, significant degradation of Pt-JM and a-PtTi40 was observed, resulting in significantly lower activity relative to PtTi40 after the ADT. PtTi25 also showed high stability, with only marginal changes in the E1/2 value after the ADT, but its activity was lower than that of PtTi40. The small changes in the E1/2 values of the PtTi25 and PtTi40 samples suggested that our Pt-Ti alloy nanoparticle electrocatalysts are promising candidates for use as stable PEMFC cathodes.


