1. Introduction
It is reported that researchers at Idaho National Laboratory (INL) in conjunction with Argonne National Laboratory (ANL) have developed a molten salt electrorefining based promising non-aqueous pyrochemical reprocessing of metal fuels, U-Pu-Zr and U-Zr discharged from fast reactors [1–3]. This method offers various advantages, such as it enables handling of short cooled high burn up fuels, allows compact process equipments for reaction, it is criticality less hazardous, generates minimum wastes and importantly, it offers resistance to nuclear proliferation of the product [4–9].
Electrorefining (ER) is the main process step in pyrochemical reprocessing, which is carried out at about 773 K in eutectic LiCl-KCl electrolyte where actinides are separated from fission products [10–12]. In ER, spent fuel is loaded in anode basket of the ER cell and dissolved in the electrolyte chemically with addition of CdCl2 or by anodic dissolution. Around 6 wt.% of actinide chlorides are loaded into LiCl-KCl eutectic during the electrorefining for better electrotransport [2,3]. The separation is based on the thermodynamic stability of the chlorides of the actinides and the fission products. U is selectively deposited on solid steel electrode and Pu, minor actinides (Np, Am, Cm) along with remaining U are co-deposited on liquid cadmium cathode leaving the fission products in the electrolyte and anode. The cathode deposits are consolidated by distillation of LiCl-KCl salt or cadmium for recovery of U and Pu from solid and liquid Cd cathodes, respectively. After several batches of ER run, the electrolyte is loaded with fission products, which results poor separation factors for actinides and lanthanides. Hence purification of the electrolyte is carried by actinide drawdown process to recover left out (2 wt.%) actinides using Li-Cd alloy [13]. A-4 Zeolite column is used to remove alkali, alkaline earth metals and fission products from the salt. The zeolites loaded with fission products are converted to glass bonded ceramic waste. The noble metals and cladding hulls in anode basket are converted to metal waste by making alloy with 15% Zr [14]. This reprocessing method is suitable for oxide fuel also where the first step is the reduction of oxide to metal and then followed by the electrorefining similar as metal fuel [15,16].
Conventionally, the entire pyrochemical reprocessing is carried out in protected environment under inert Ar atmosphere. This is because of the hygroscopic and air sensitive nature of the metal (actinides, lanthanides) chlorides, spent metallic fuel, electrolyte salt LiCl-KCl, actinide electrodeposits, among others [14,17,18]. Thus, utmost care is taken to prevent contamination of the chloride salts with the trace amount of O2 in Ar gas, or unintended ingression of O2 through gauntlets, rubber gaskets/O-rings, leaky joints of the containment chamber, etc. This precaution is necessary because O2 converts actinide and lanthanide chlorides to insoluble oxides in LiCl-KCl media, which precipitate and subsequently accumulate in the process vessels. This oxidation leads to a decrease in the process efficiency and renders the products contaminated with impurities. Therefore, the conversion of oxides of actinides to their tri-chlorides and in turn, using these as electrolytes are very important aspect in pyrochemical reprocessing.
About one-fourth of the total fission products produced in the nuclear fission of U and Pu are lanthanides (Ln=La, Ce, Pr, Nd, Sm and Eu) [19]. Lanthanides (Ln) have similar chemical properties as actinides and therefore, during conversion of actinide oxides to its chlorides, Ln oxides may react with the chlorinating agent and form chlorides. In the process, the thermodynamic stability of the chlorides and the kinetics of the reactions determine the final products. Therefore, a detailed study of the conversion process of Ln is very important to control the efficiency of the conversion process of actinides. In the last few decades, many researchers have reported the chlorination of actinide and Ln oxides. Liu et al. [20] have reported chlorination of Sm2O3 to SmCl3 using AlCl3 and subsequent electrochemical extraction of Sm from the chloride melt. Authors have reported a chlorination efficiency of 95.4%, but have not elaborated on the optimization of the parameters, such as concentration of AlCl3, duration of reaction and the amount of LiCl-KCl to achieve the reported conversion efficiency. Martincic et al. [21] have reported synthesis of dry SmCl3 from Sm2O3. The presence of SmCl3 as final product is confirmed by synchrotron X-ray powder diffraction technique. Papatheodorou et al. [22] have studied vapour complexes of samarium (III) and samarium (II) with AlCl3. Authors have reported the preparation of SmCl3, NdCl3, NdBr3, PrCl3, ErCl3, YCl3, ThCl4, UCl3 and UCl4 by reacting with corresponding oxides with AlCl3 or AlBr3. Liu et al. [23] have reported the separation of UO2 from Ln oxides (La, Nd, Ce, Sm) using AlCl3 in LiCl-KCl melt. Thus, AlCl3 is widely used for conversion and extraction of rare earths from its corresponding oxides (Gd2O3, CeO2, Pr6O11, Eu2O3, Yb2O3, Nd2O3) using Al electrode or by co-deposition with Al3+ ions [24–31]. In addition, literatures are also available on the chlorination of actinide oxides and Ln oxides by using ZrCl4 [32] and NH4Cl as well [33,34].
Though feasibility studies on the chlorination of Ln2O3 (Ln: lanthanides) with AlCl3 have been widely reported, yet factors affecting the efficiency of the conversion process as well as optimum condition for getting maximum conversion have not been studied in details. Thus, in order to delve deep into the chlorination of Ln2O3, in this work, conversion reactions of Sm2O3 to SmCl3 with AlCl3 are taken up. Sm being neutron poison, it needs to be removed from spent metallic fuel in the electrorefining step of pyrochemical reprocessing. Hence, detail studies on conversion of Sm2O3 in LiCl-KCl are essential for further processing of the processed salt. The optimum conditions for achieving higher thermochemical conversion efficiency are also undertaken. Presence of SmCl3 in LiCl-KCl is confirmed by electrochemical analysis and X-ray diffraction technique. UV-Vis and fluorescence spectroscopy are employed to confirm the conversion of Sm2O3 to SmCl3. Influences of the amount of electrolyte LiCl-KCl salt, concentration of AlCl3 and duration of reaction on the efficiency of the conversion process of oxides are studied in details.
2. Experimental
2.1. Reagents
LiCl (M/s Sigma Aldrich, anhydrous, 99 wt.%), KCl (M/s Alfa Aesar, anhydrous, 99 wt.%), AgCl (M/s Alfa Aesar, anhydrous, 99.99 wt.%), AlCl3 (M/s Alfa Aesar, anhydrous, 99.985 wt.%), anhydrous SmCl3 (M/s Alfa Aesar, 99.99 wt.%) and Sm2O3 (M/s Indian Rare Earths, 99.9 wt.%) were used in the present study. Quartz distilled HNO3 (M/s Merck, India) was used in the chemical analysis. De-ionized water (18Mω) was used for the preparation of samples.
2.2. Preparation of LiCl-KCl eutectic and LiCl-KCl-1 wt.% AgCl
All chemicals were handled inside a glove box in Ar ambient at 20 to 60 mm of water column pressure. Oxygen and moisture impurity levels of the glove box were maintained below 10 ppm. A rotary vacuum pump (ED-15, M/s Hindhivac Private Ltd., Bangalore, India) was used to dry LiCl and KCl eutectic mixture (mole ratio of LiCl:KCl = 58.8:41.2, m.p. 626 K) at 425 K for 120 h. The vacuum dried LiCl-KCl mixture (300 g) was loaded in alumina crucible and placed inside a chlorination vessel, which was made of quartz bottom cell attached with a teflon top flange. The salt was melted in chlorine gas atmosphere. After melting, chlorine gas was bubbled through the melt for 0.5 h at 773 K. Subsequently, Ar gas was bubbled through the melt for about 1 h to remove excess chlorine. Finally, the salt was cooled under Ar gas flow and stored inside a glove box.
LiCl-KCl-1wt.% AgCl was prepared by grinding the required amount of AgCl in a mortar pestle, thoroughly mixing with purified LiCl-KCl salt inside the Ar box and chlorinating at 773 K following a similar method as described above for blank LiCl-KCl salt.
2.3. Conversion reaction of Sm2O3
Both AlCl3 (S) and Sm2O3 (S) were dried inside the glove box to remove any moisture present in these before performing the conversion experiments. Weight loss profile of Sm2O3 was studied with thermo gravimetric analysis (TGA/SDTA 851; M/s. Mettler Toledo Instrument Co. Ltd, Switzerland) in the temperature range from room temperature (300 K) to 1273 K.
The conversion reaction was carried out inside the argon glove box pit, which was attached with a split type furnace at the bottom of the glove box with a provision of cooling by recirculating chilled water. The schematic diagram of experimental set up for conversion reaction is given in supplementary data (see supporting Fig. S1). LiCl-KCl eutectic mixture was loaded in alumina crucible, which was kept inside a secondary iron crucible in the pit. After melting the salt, pre-dried Sm2O3 and AlCl3 were added to the melt at 773 K under continuous stirring with an in-house fabricated tantalum stirrer at 400 rpm. The experimental temperature of 773 K in the present study was selected as per the standard operating temperature of similar pyrochemical process above the melting point (626 K) of LiCl-KCl eutectic melt [23].
2.4. Spectroscopic analysis
After conversion reactions, the salts retrieved at the end of the above process were dissolved in H2O and filterd using Whatman-42 paper. Chloride salts such as LiCl, KCl, SmCl3 and AlCl3 were dissolved in water while oxides were insoluble in nature. The filtrate (sample F-1) was stabilized with dilute HNO3 (0.01 M) to avoid hydrolysis and was analysed for Sm and Al. The water insoluble part (containing Sm2O3 and Al2O3) was dissolved in 8 M HNO3 and filtered). In this, only Sm2O3 was dissolved while Al2O3 was insoluble. The dissolved portion (sample F-2) was analysed for Sm and the amount of unreacted Sm2O3 was calculated. Standard SmCl3 solution was prepared by dissolving commercially procured SmCl3 (Alfa Aesar, 99.99 wt.%) in water and adjusting the solution with 0.01 M HNO3.
Sample F-1 and F-2 were analysed for quantitative estimation of Sm with a spectrophotometer (AvaSpec-2048, Netherlands) in the range of 220–480 nm. Fluorescence spectra were recorded with Edinburgh spectrofluorimeter (model FLS920) for qualitative assessment of Sm. In addition, F-1 and F-2 were quantitatively analysed for Sm and Al by ICP-AES (M/s. Ametek GmBH, Spectro Arcos, Germany) which had polychromator with recirculation purging facility and hermetically sealed CCD detector.
2.5. Powder X-ray diffraction (XRD)
The reaction product was analysed with XRD (M/s. GNR Explorer, Italy, Cu-Kα1, l ~1.5406 Å). Samples were prepared and loaded on zero diffraction holder and covered with Scotch tape to avoid the effect of atmospheric oxygen and moisture during diffraction measurement.
2.6. Procedure for electrochemical analysis
After the conversion reaction, electrochemical studies were carried out with the reaction product in a tapered and recrystallized alumina crucible (OD~ 44 mm, L~100 mm) which in turn was loaded inside a cylindrical vessel made of SS 304 L seamless pipe (ID~54 mm, L~500 mm) attached with CF-63 flange. Tungsten (W) and molybdenum (Mo) wire were used as working electrodes during electrochemical analysis (voltammetry). A high density (>1.8 g cm−3) graphite rod (D~8 mm, L~50 mm) was attached to a SS wire and was used as counter electrode. The reference electrode was made of pyrex tube (ID~4 mm, OD~6 mm, and ~500 mm). Bottom portion of the tube was shaped like a bulb of thin membrane. LiCl-KCl-1wt.% AgCl along with Ag wire as loaded into the pyrex tube. The potentials reported in this work were measured with respect to this Ag/AgCl reference electrode.
The electrochemical cell was degassed at 673 K for 4 h under vacuum along with counter electrode and alumina crucible to remove any adsorbed moisture and gaseous impurities. It was loaded with electrolyte and reference electrode inside the inert glove box. After loading the cell, it was taken out of the glove box and was kept in a furnace at 773 K under Ar atmosphere. The temperature of the melt was measured with a chromel-alumel thermocouple (K-type) sheathed in an alumina tube by immersing it in the electrolyte. Voltammograms were recorded with Iviumstat. xre potentiostat (M/s Ivium Technologies, Netherlands).
3. Results and Discussion
3.1. Electrochemical analysis
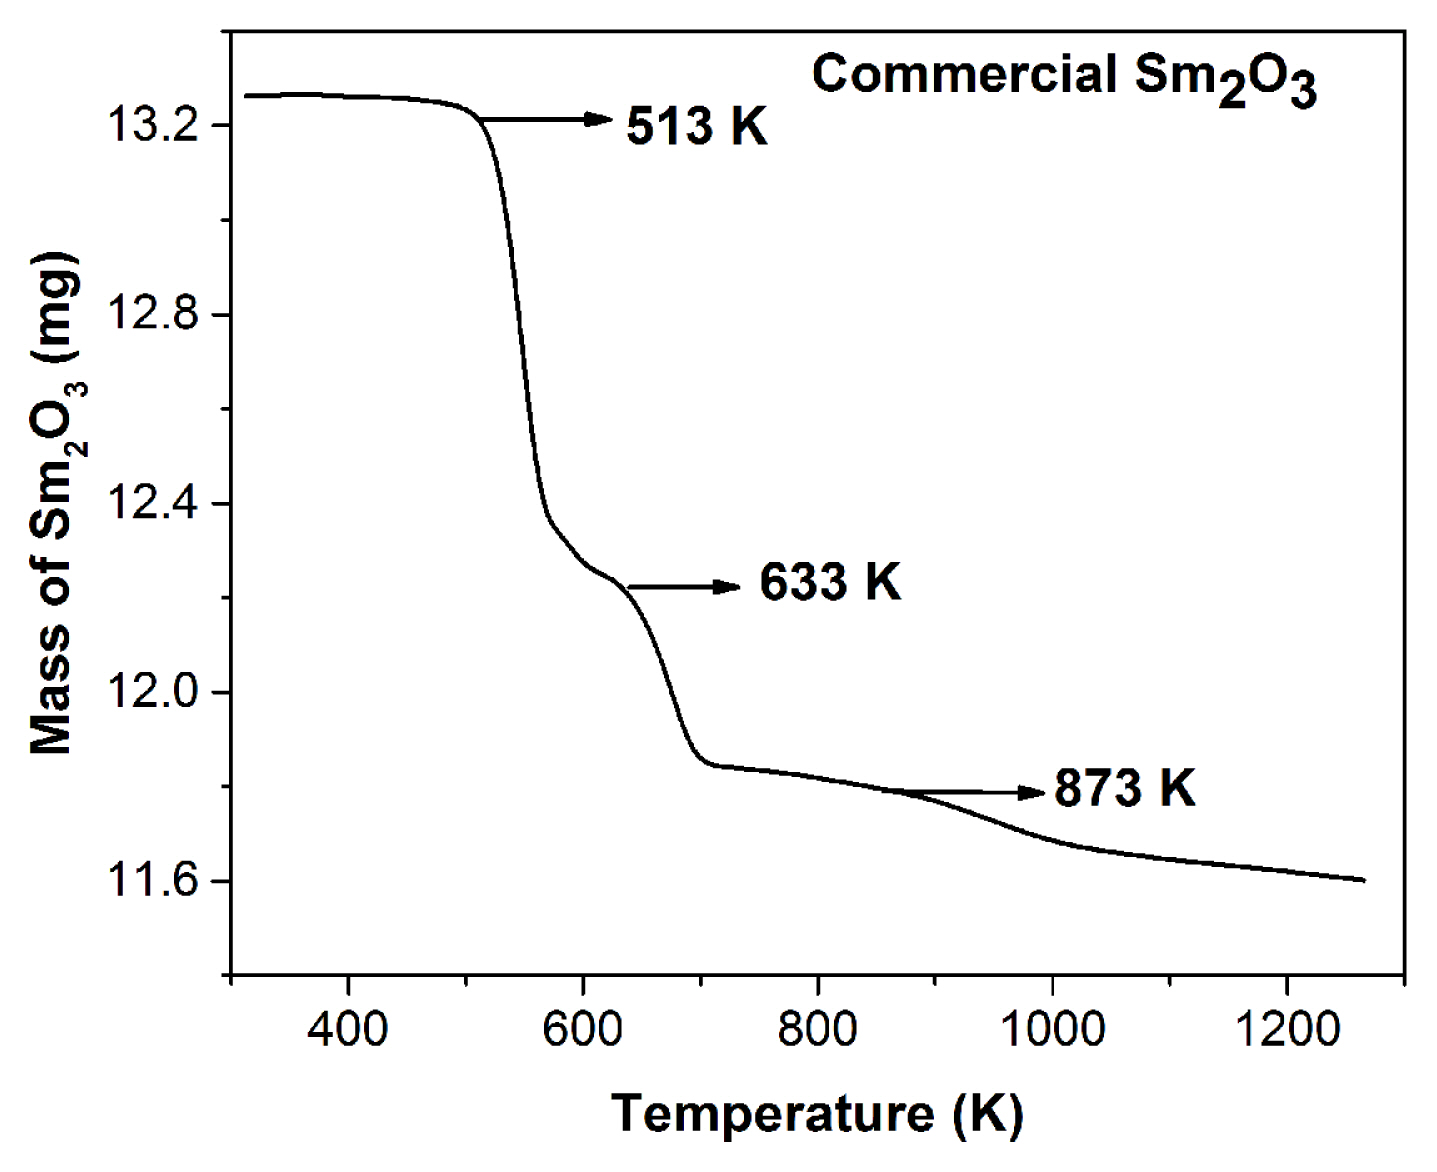
TGA plots for commercially procured Sm2O3 powder in the temperature range of 323–1273 K is shown in Fig. 1. The profile reveals three regions of mass loss at 513 K, 633 K and 873 K. The first mass loss is due to the adhered water molecule and second and third mass losses are due to the presence of hydroxide and carbonate impurities. To purify the commercial Sm2O3, 10.0 g (per batch) of Sm2O3 is heated in two steps. In the first step, heating is done at 520 K for 15 h and in the second step, heating is carried out at 935 K for 15 h. After drying, an average mass loss of ~ 1.0 g per batch is observed for Sm2O3. In addition, 8.0 g (per batch) of AlCl3 is heated inside the glove box at 350 K for 20 h in Ar atmosphere. As a result, an average mass loss of ~ 2.0 g per batch is recorded for AlCl3.
As discussed in the experimental section, the conversion reaction is carried out inside the argon glove box pit at 773 K. The reaction of Sm2O3 and AlCl3 is written as
The feasibility of the above chlorination reaction is verified by calculating the Gibbs free energy of the reaction (ΔGθ) at 773 K using the reaction module of Fact Sage 6.4 software [35]. The value of ΔGθ is found to be −403.35 kJ which confirms that the reaction is thermodynamically favourable at 773K.
According to the Eq. (1), SmCl3 and Al2O3 are the reaction products. Thus, LiCl-KCl melt contains Sm2O3 + AlCl3 before equilibration, Sm2O3 + SmCl3 + Al2O3 + AlCl3 during equilibration and SmCl3 + Al2O3 after equilibration. Among these products, SmCl3 and AlCl3 are soluble electroactive species in LiCl-KCl melt. Cyclic voltammograms (CV) and squarewave voltammograms (SWV) help in determining the redox viz. Sm3+ and Al3+ species present in the electrolyte [36]. In the present study, CV and SWV are recorded in equilibration product of LiCl-KCl-Sm2O3-AlCl3 at 773 K to identify the presence of Sm3+ and Al3+ ions in the electrolyte. The schematic of the electrochemical cell assembly is given in supplementary data (see supporting Fig. S2).
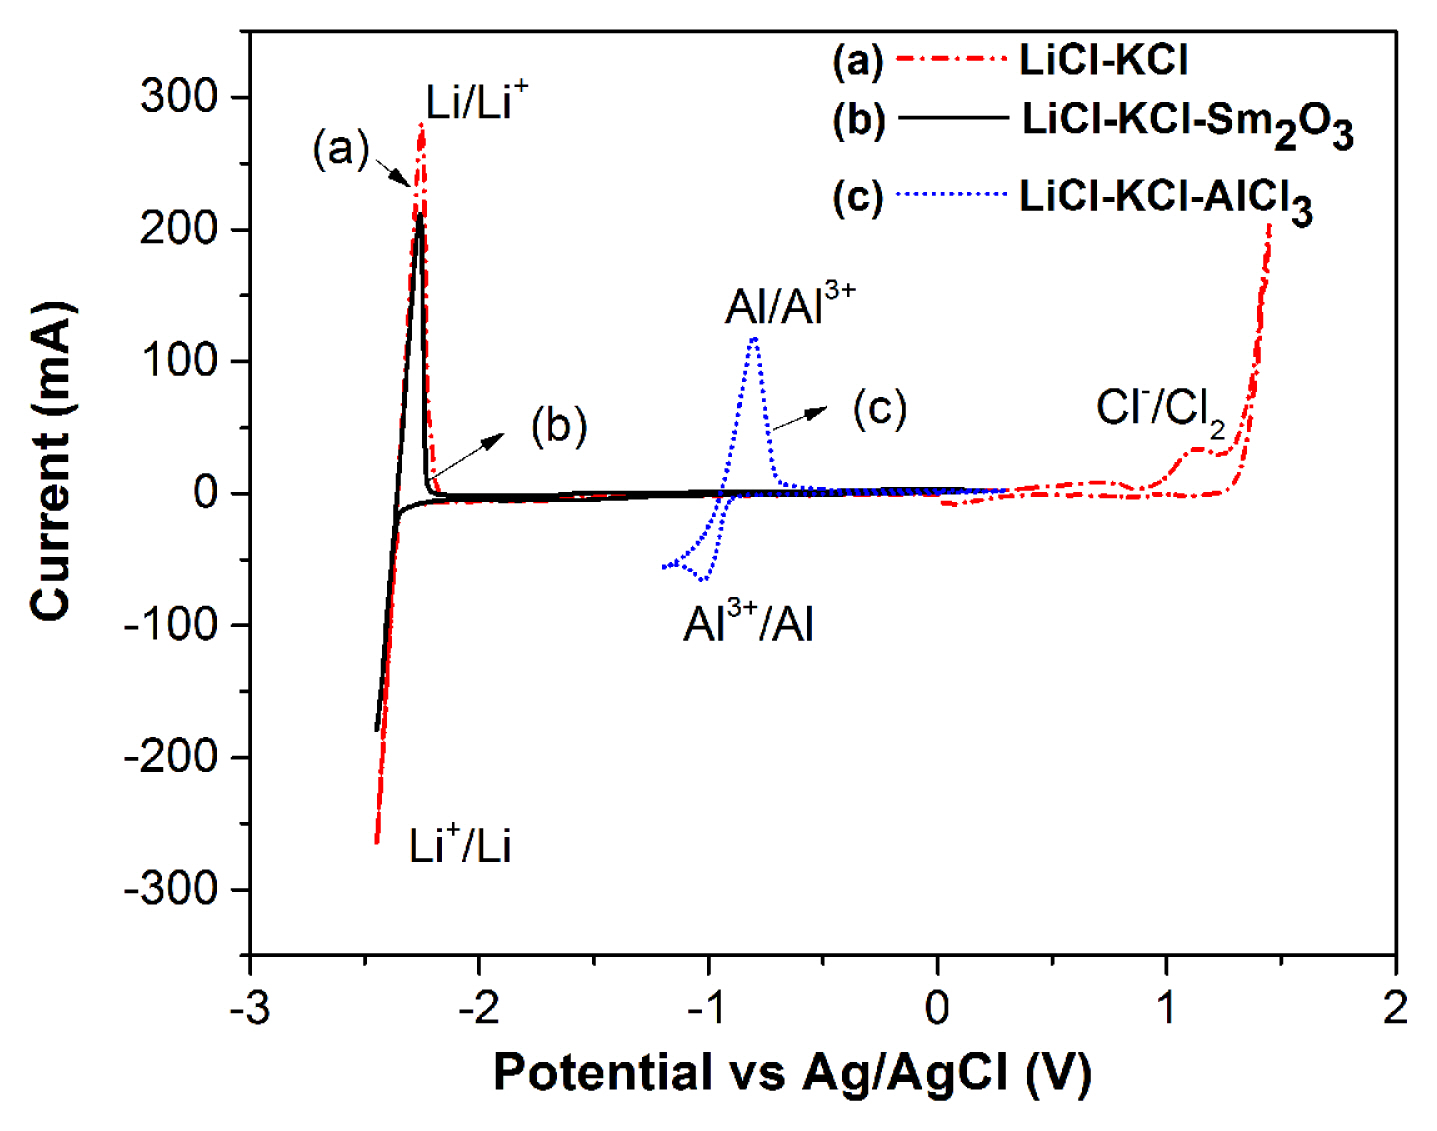
CVs are recorded using W (for converted SmCl3), Mo (for commercial SmCl3) as working electrode, graphite as counter electrode and Ag/AgCl as reference electrode. The line marked (a) in Fig. 2 shows the CV recorded for blank LiCl-KCl eutectic melt in the potential range +1.5 V to −2.45 V. The cathodic limit is due to reduction of Li+ to Li metal at −2.35 V. The anodic limit of the melt is due to the oxidation of Cl− ion to Cl2 gas at +1.15 V. The line marked (b) in Fig. 2 shows the representational behaviour of Sm2O3 in LiCl-KCl melt in the present work. CV recorded for LiCl-KCl-Sm2O3 melt (4.3 × 10⁻⁵ mol cm−3) in the potential range of −2.45 V to + 0.5 V shows peaks only for Li+/Li reduction and Li/Li+ oxidation, which are similar to blank LiCl-KCl salt. No characteristic current peaks for Sm3+ ions are observed in this voltammogram and this is ascribed to the absence of electrochemically active species in LiCl-KCl melt. As the chlorination process uses AlCl3, the redox behaviour for Al3+ ions are studied in LiCl-KCl electrolyte. The line marked (c) in Fig. 2 shows the CV recorded in LiCl-KCl-AlCl3 melt (5.5 × 10⁻⁴ mol cm−3), which exhibits a cathodic peak at −1.02 V and an anodic peak at −0.80 V corresponding to Al3+/Al redox couple. To study the redox behaviour, commercially available SmCl3 is added to the LiCl-KCl melt at 773 K, stirred for 2 h and subsequently CVs are recorded. In Fig. 3 line marked (a) shows the CVs recorded in LiCl-KCl-SmCl3 (7.9 × 10⁻⁵ mol cm−3) salt at 773 K on inert (Mo) electrode. A pair of peaks (A/A′) is observed in the voltammogram around −0.8 V in addition to the peaks related to Li+/Li reduction and Li/Li+ oxidation. The cathodic peak at −0.80 V and corresponding anodic peak at −0.65 V are due to the reduction and oxidation of Sm3+ ions in the LiCl-KCl electrolyte. In order to carry out a detail study on the conversion reaction, different amount of dried Sm2O3 is equilibrated with AlCl3 at 773 K. The reaction products of the equilibrated LiCl-KCl-SmCl3 melt are given in Table 1,–3.
The concentrations of Sm are determined with UV-Vis spectrophotometry analyses and are discussed in detail in the latter section. At this point, a comparative CV study is carried out with 3.46 g of Sm2O3 equilibrated with 5.31 g of AlCl3 in 100 g of LiCl-KCl for 6 h at 773 K. Thus, the CV recorded in equilibrated LiCl-KCl-SmCl3 (3.08 × 10⁻⁴ mol cm−3) melt is shown with line marked (b) in Fig. 3. A pair of peaks (A1/A′1) is observed in the voltammogram around −0.80 V and the cathodic peak at −0.78 V represents the Sm3+/Sm2+ reduction in the melt similar to LiCl-KCl-SmCl3 (commercial) electrolyte. This confirms the conversion of Sm2O3 to SmCl3 in LiCl-KCl melt. Interestingly, the absence of cathodic peak at −0.9 V corresponding to Al3+/Al0 indicates complete consumption of AlCl3 used for the chlorination of Sm2O3.
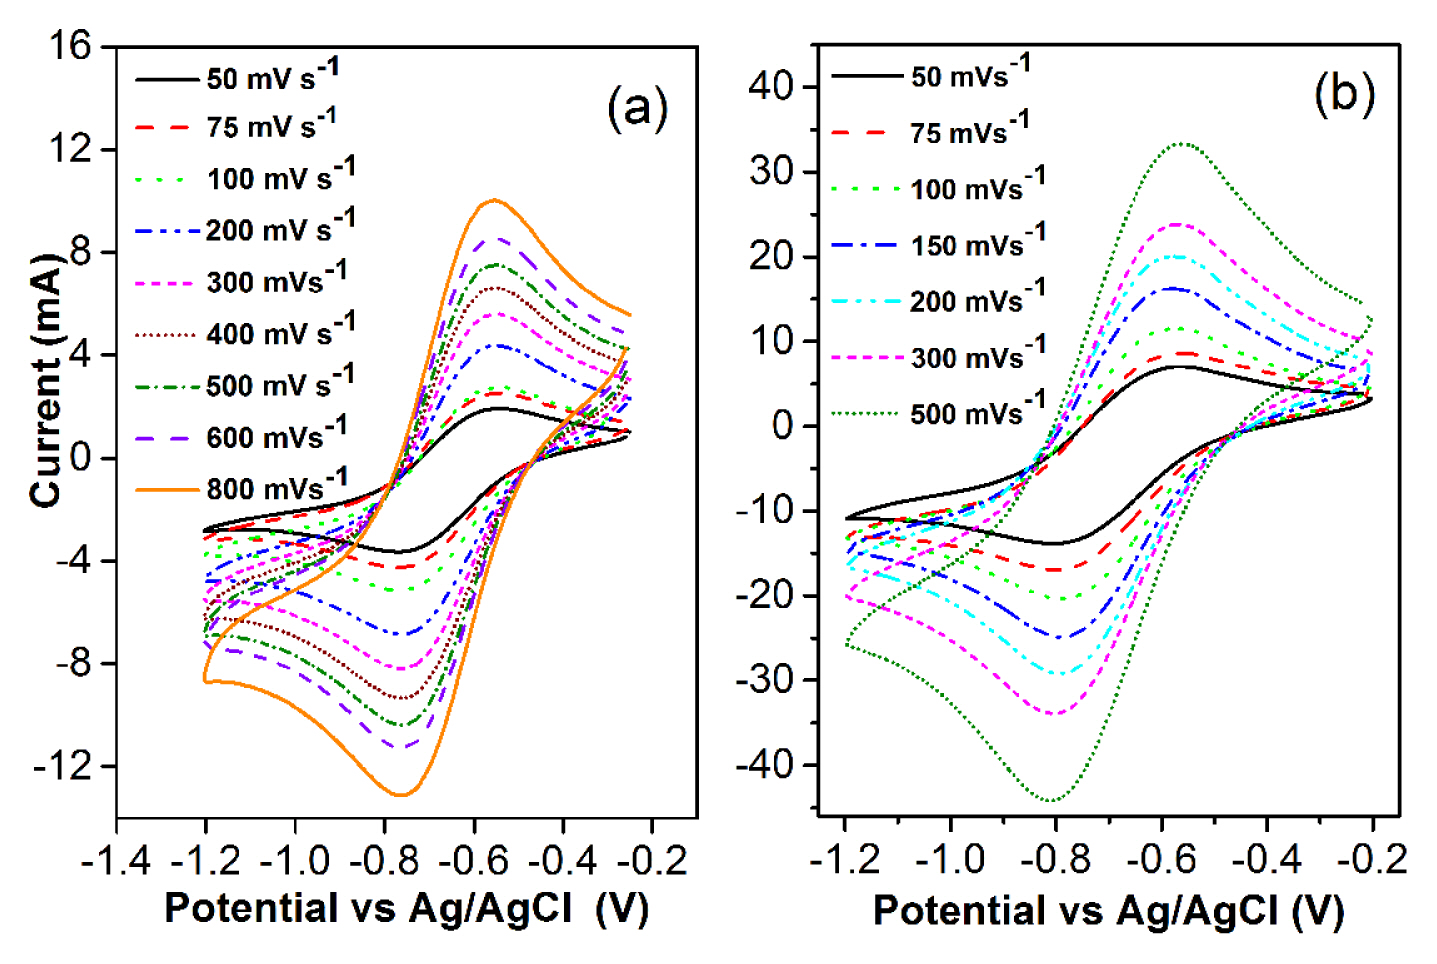
CVs are recorded on LiCl-KCl-SmCl3 (commercial, 6.5 × 10⁻⁵ mol cm−3) melt in the potential range 0 to −1.2 V at different scan rates ranging from 75 to 800 mV s−1 (see Fig. 4a). It is observed that the peak potentials do not change with the scan rates. The shape of the voltammograms resemble closely to reversible soluble-soluble system in the melt. Fig. 4b shows the CVs recorded in equilibrated LiCl-KCl-SmCl3 (~3.08 × 10⁻⁴ mol cm−3) melt at different scan rates from 50 to 500 mV s−1 at 773 K. The number of electrons transferred in the reduction process is calculated using the equation
where Ep is cathodic peak potential (V), Ep/2 is cathodic half peak potential (V), R is the universal gas constant (8.314 J K−1 mol−1), T is the absolute temperature (K) and F is the Faraday constant (96485 C mol−1).
Details of the peak analyses are given in Table 4 and it is seen that the difference between cathodic peak potential Ep (V) and cathodic half peak potential Ep/2 (V) remains almost same for each scan rate.
The value of n has been estimated using Eq. (2) and listed in the Table 4. The number of electron transfer for LiCl-KCl-SmCl3 (commercial) is found to be 1.08 ± 0.03, which points to the fact that Sm3+ reduction is a one electron transfer process and the reduction is expressed as
It is not feasible to study the Sm2+/Sm redox system in this electrochemical window as the reduction potential of Sm2+/Sm is more negative than Li+/Li [37]. Similar observations have been reported by Cordoba and Castrillejo et al. [38,39].
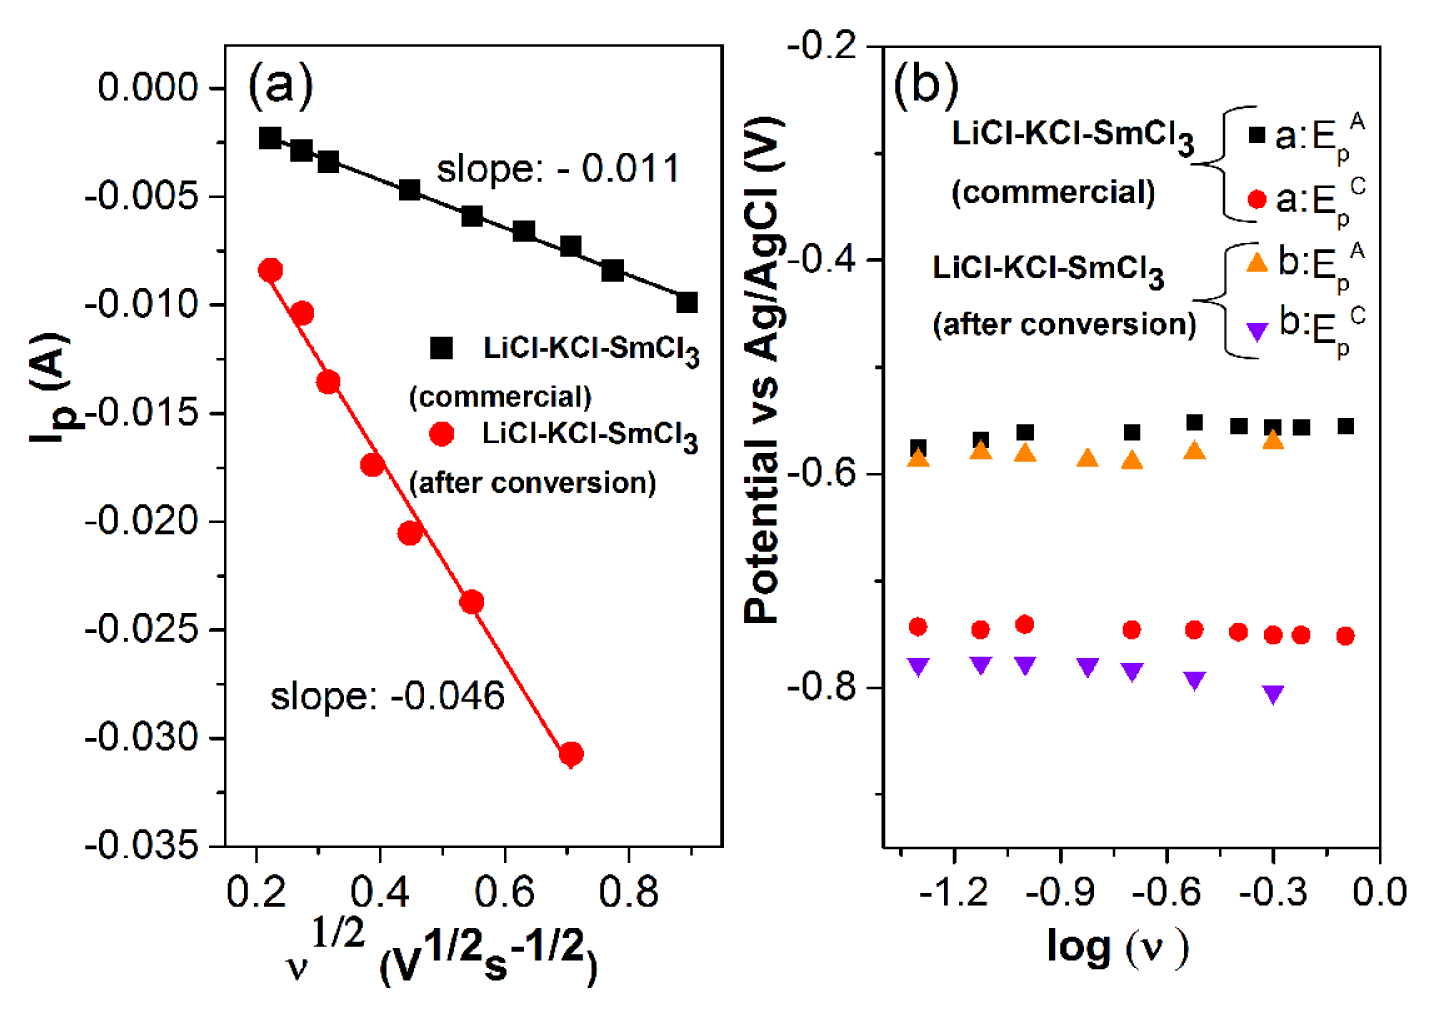
The number of electron transfer for equilibrated LiCl-KCl-SmCl3 is calculated as 1.02 ± 0.02 which indicates that Sm3+ is reduced to Sm2+. Identical number of electron transfer is calculated for the commercially procured SmCl3 (6.5 × 10⁻⁵ mol cm−3). The cathodic peak current of CV is related to the potential scan rate according to the Randles-Sevcik equation [40]:
Where, Ip is the cathodic peak current (in Amp), A is the electrode area (cm2), C0 is the solute concentration (mol cm−3), D is the diffusion coefficient (cm2 s−1) and ν is the potential sweep rate (V s−1).
In Fig. 5a, the Ip is plotted against
ν ν ν
The plot of cathodic and anodic peak potentials (
E p c E p A
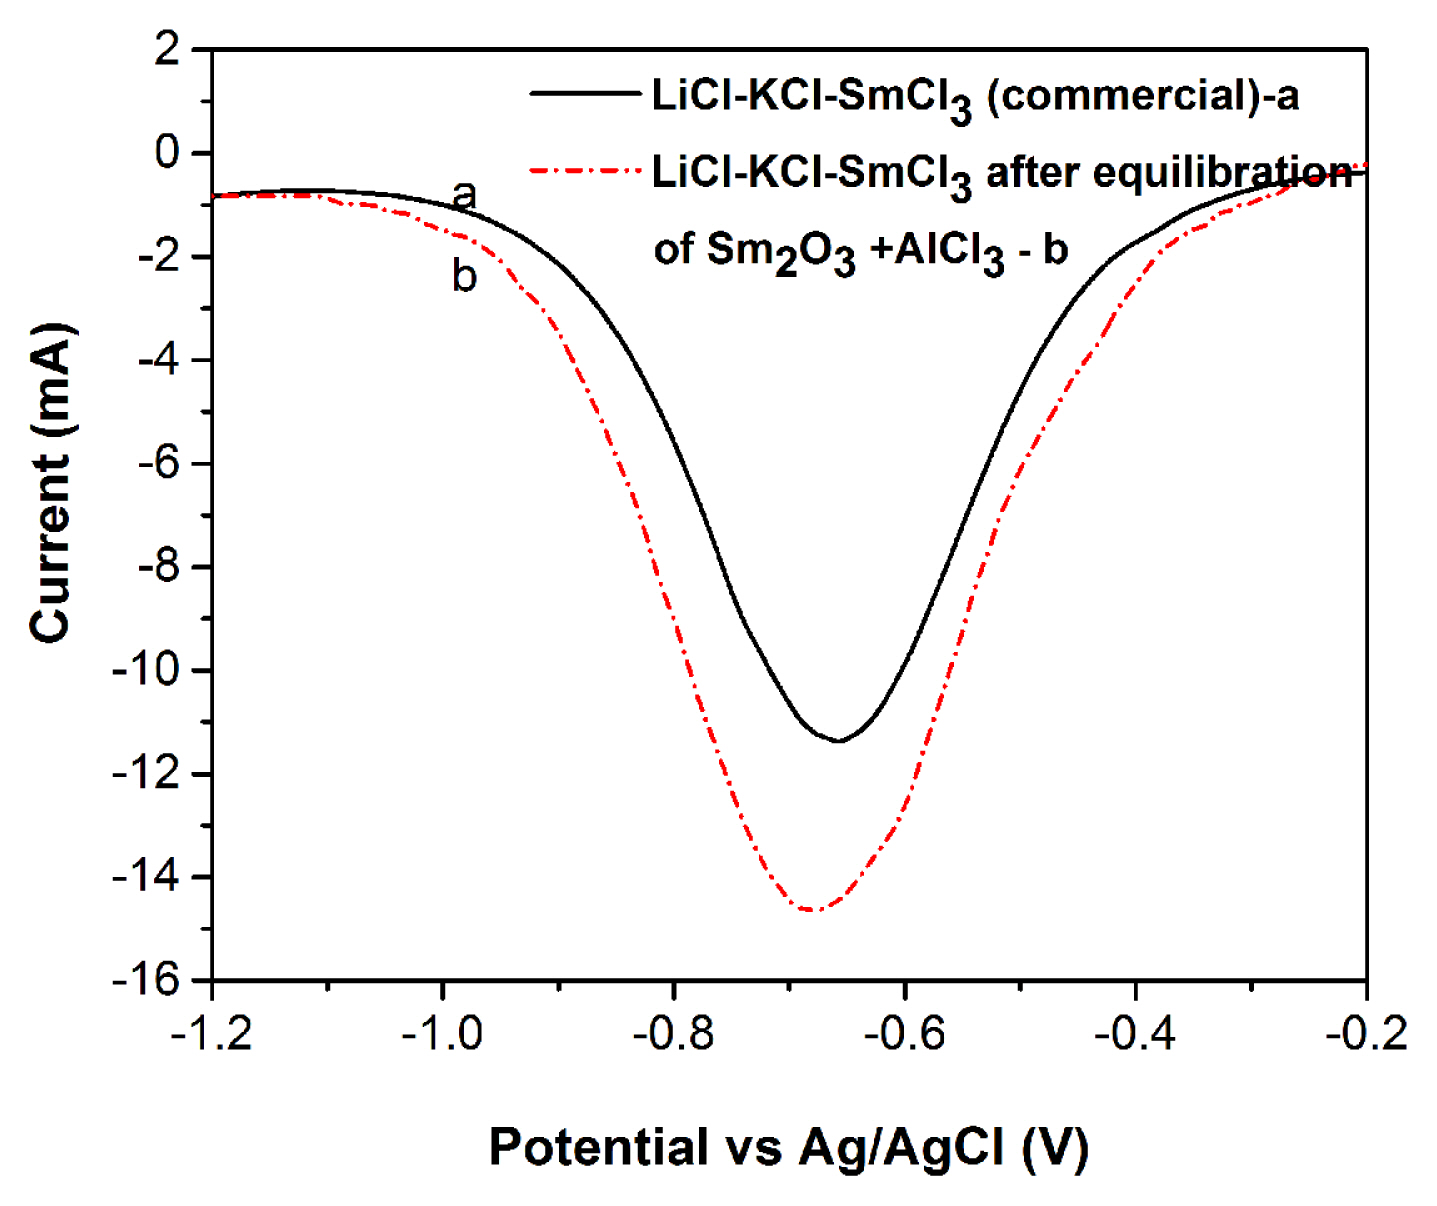
Equilibrated LiCl-KCl-SmCl3 is compared with LiCl-KCl-SmCl3 (commercial) by SWV method. SW voltammograms are recorded for LiCl-KCl-SmCl3 (commercial, 6.5 × 10⁻⁵ mol cm−3) as well as in equilibrated LiCl-KCl-SmCl3 (~3.08 × 10⁻⁴ mol cm−3) in the potential range −0.2 to −1.2 V at amplitude of 10 mV with varying pulse frequencies at 773 K. In Fig. 6, the representative SWV recorded at 12 Hz for LiCl-KCl-SmCl3 (commercial, 6.5 × 10⁻⁵ mol cm−3, marked a) shows only one cathodic peak at −0.66 V, which is due to the reduction of Sm3+ ions in the melt [38,39]. In the same figure the representative SWV shown for equilibrated LiCl-KCl-SmCl3 melt (~3.08 × 10⁻⁴ mol cm−3, marked b) exhibits a cathodic peak at −0.67 V, which confirms the formation of SmCl3 from Sm2O3.
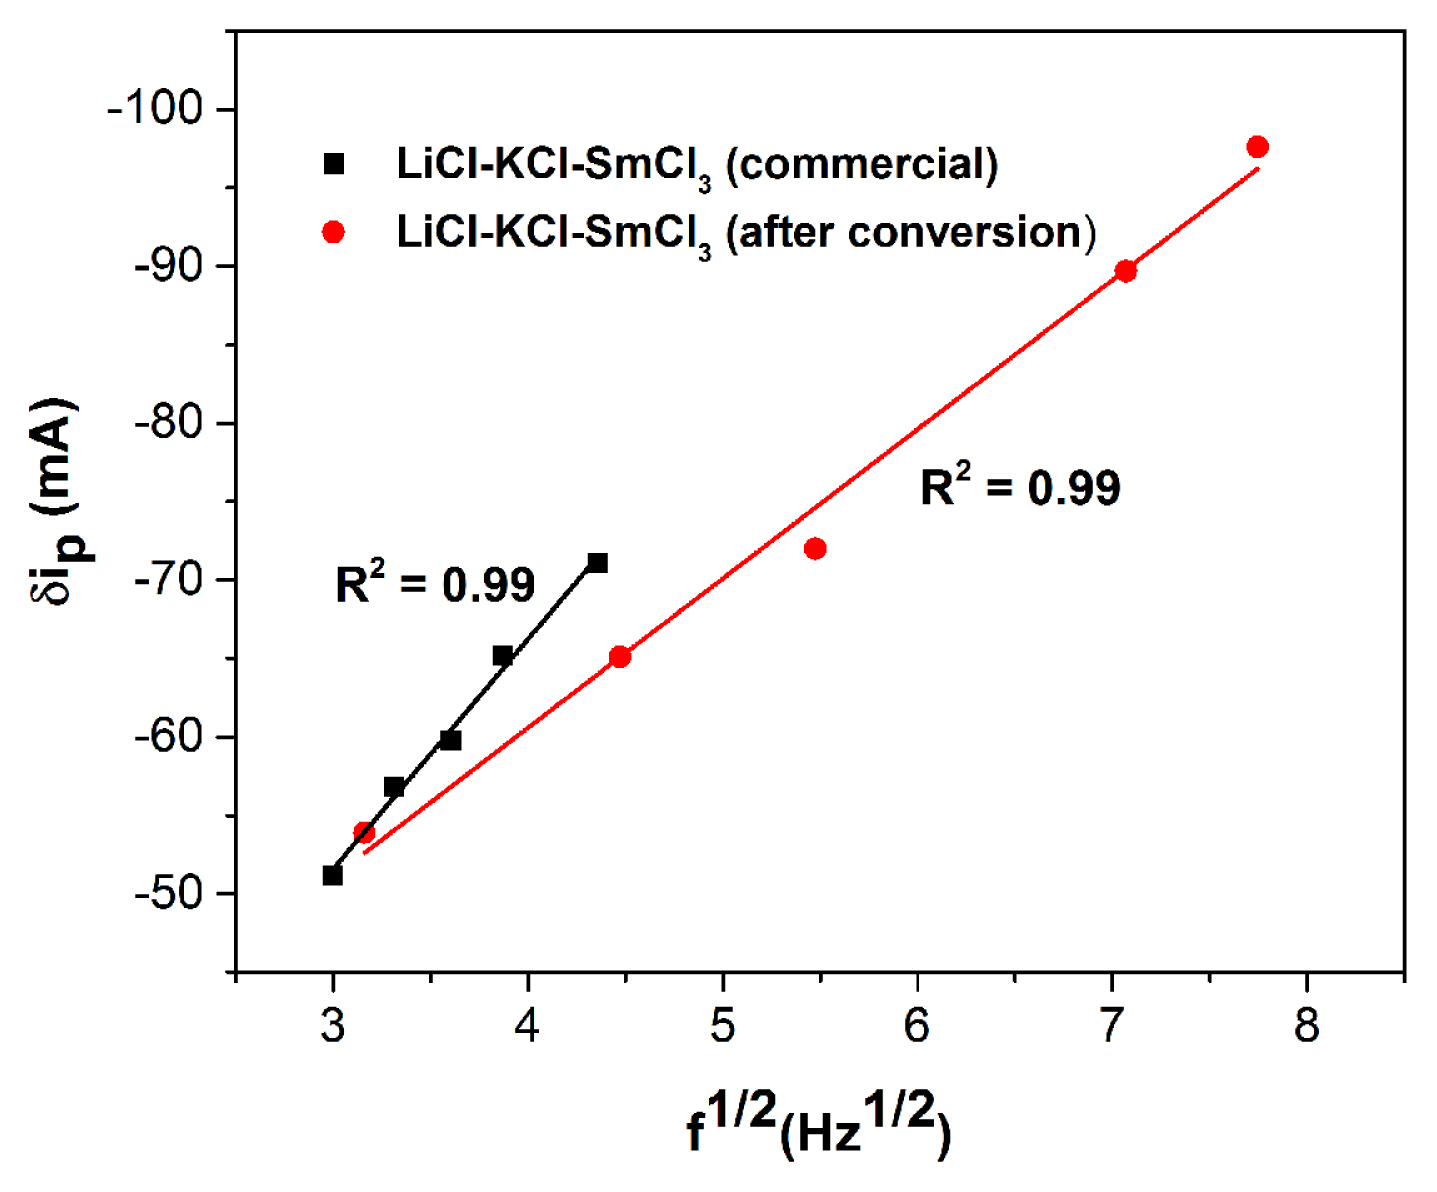
Osteryoung and Ramaley et al [41,42] showed that for the ideal cases involving reversible system, the differential peak current δip is directly proportional to the concentration of the electroactive species and square root of pulse frequency (
f
where,
Γ = e x p ( n F Δ E 2 R T )
wWhere ΔE is the amplitude of square wave potential, A is the electrode area (cm2), C0 is the solute concentration (mol cm−3), D is the diffusion coefficient (cm2 s−1).
Fig. 7 shows the plot of δip vs
f f
For a SWV in LiCl-KCl-SmCl3 (commercial, 6.5 × 10⁻⁵ mol cm−3) at frequency of 12 Hz and amplitude of 30 mV, the value of n is estimated as 0.98 ± 0.03, which confirms the fact that Sm3+ is reduced to Sm2+. The number of electron transfer for equilibrated LiCl-KCl-SmCl3 (~3.08 × 10⁻⁴ mol cm−3) is determined as 0.97 ± 0.02 for a SWV at frequency of 12 Hz and amplitude of 40 mV, which is similar to commercial SmCl3 reduction and reflects the reduction of Sm3+ to Sm2+. The values of n determined with Eq. (2) and (5) are very close (see Table 4). In the process, CV and SWV studies confirm the presence of Sm3+/Sm2+ redox couple in LiCl-KCl validating the conversion of Sm2O3 to SmCl3.
3.2. X-ray diffraction
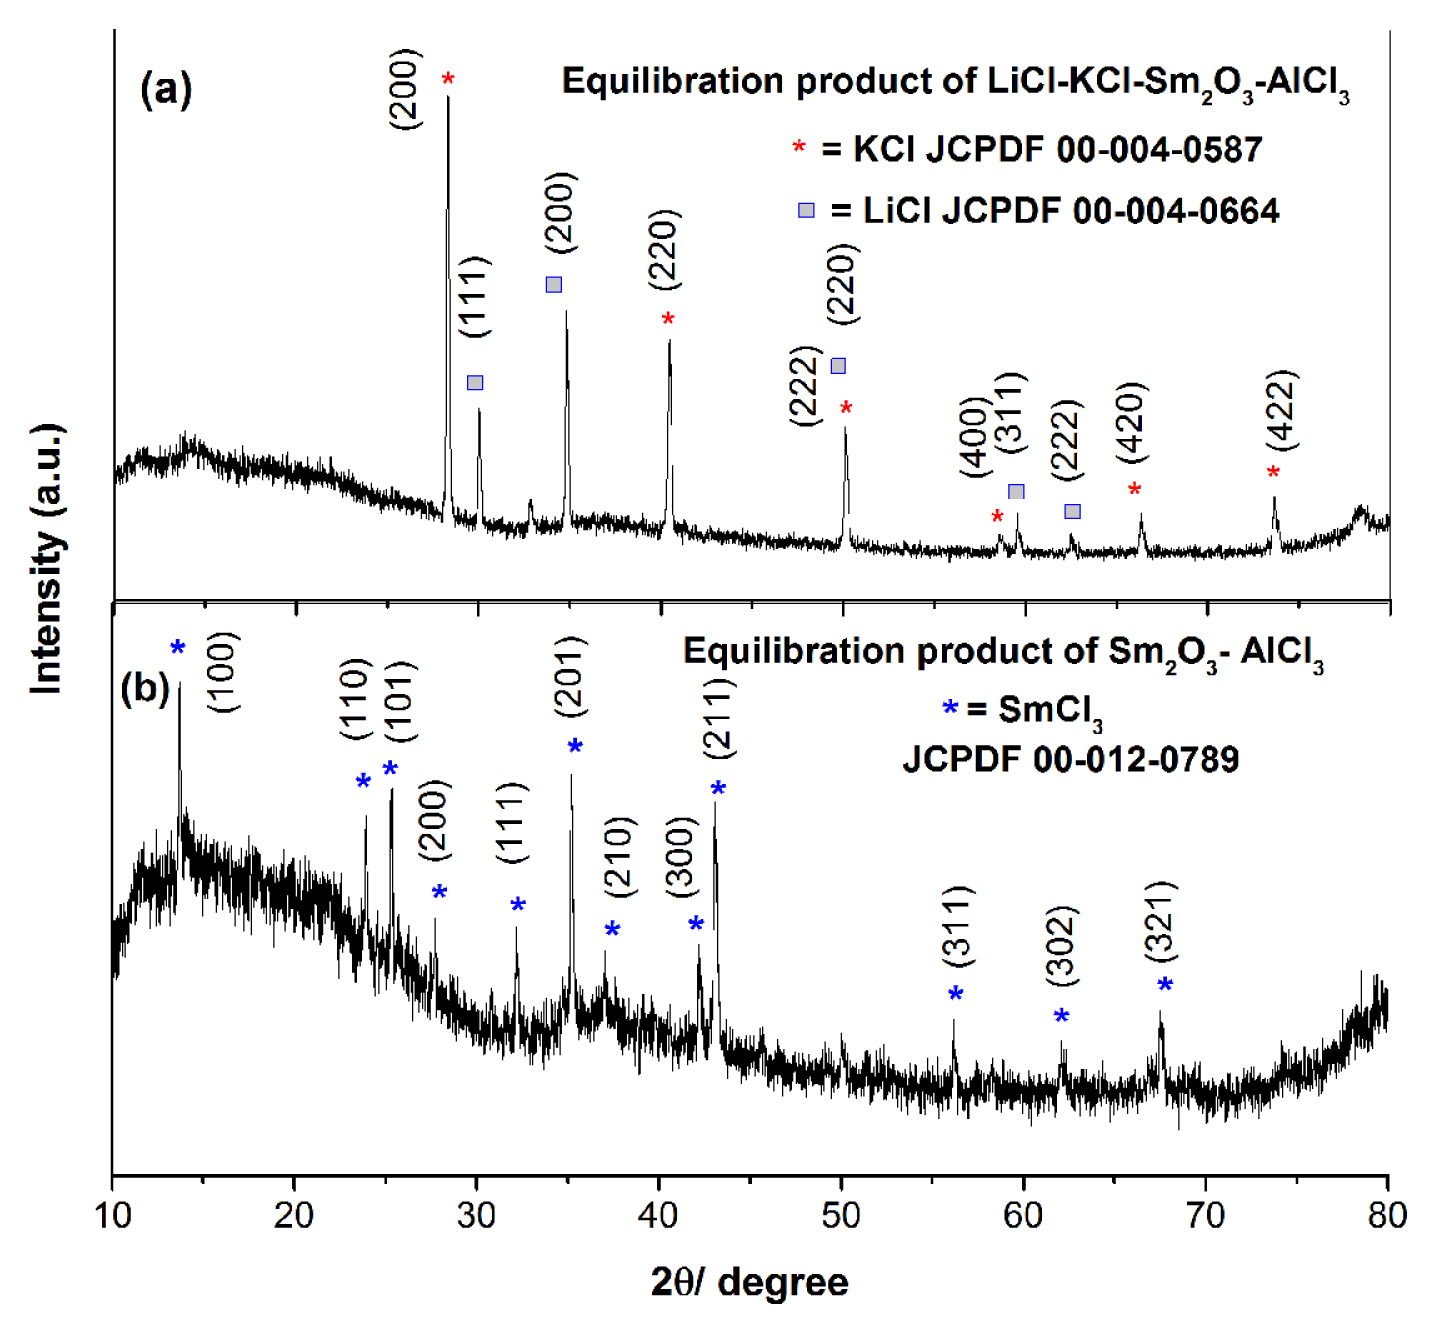
Powder XRD analyses are performed with the products obtained after conversion of Sm2O3 to SmCl3 to ascertain the conversion reaction. XRD of LiCl-KCl salt (Table 3, E-2-10) after 6 h of equilibration of Sm2O3 and AlCl3 (Fig. 8a) shows the diffraction peaks for only LiCl and KCl. Hence, another experiment is carried out in absence of LiCl-KCl (Table 3, E-2-S) for eliminating the salt matrix effect in XRD pattern. The reaction is carried out by placing homogenously mixed Sm2O3 and AlCl3 (1: 1.5 wt. ratio) for 2 h at 773 K followed by cooling and grinding. The procedure is repeated every 2 h and total 12 h of heating is performed. The XRD pattern of the product is shown in Fig. 8b where presence of SmCl3 is observed. Powder XRD analysis of the product also proves the conversion of Sm2O3 to SmCl3 with the aid of AlCl3.
3.3. Fluorescence and UV-Vis spectroscopic analysis
Conversion reactions of Sm2O3 to SmCl3 are carried out in LiCl-KCl media using different concentrations of AlCl3 at 773 K (see Table 1), duration of the reaction (see Table 2) and the amount of LiCl-KCl (see Table 3).
In the present study, sample F-1 (water dissolved part) is analysed by fluorescence spectroscopic method to ascertain the conversion of Sm2O3 to SmCl3. Fig 9 shows the emission spectra recorded with the F-1 (marked a, Table 2, E-2-6) in the wavelength range 530–675 nm with an excitation wavelength (λex) of 402 nm and compared with the standard SmCl3 (commercial) solution in the same wavelength range (plot, marked b). There are three emission peaks (in both the cases) located at 559 nm, 594 nm and 643 nm correspond to the Sm3+ intra-4f transition from the excited levels to lower levels, the 4G5/2→6H5/2, 4G5/2→6H7/2 and 4G5/2→6H9/2 transitions, respectively. It is seen from the figure that the characteristic emission peaks of Sm in the filtrate are well matched with that of the standard and it is in line with the earlier studies on fluorescence spectra of Sm3+ ions in molten LiCl-KCl as well as in different phosphors [44,45]. This clearly indicates to the presence of SmCl3 in the F-1 and confirms the conversion of Sm2O3 to SmCl3.
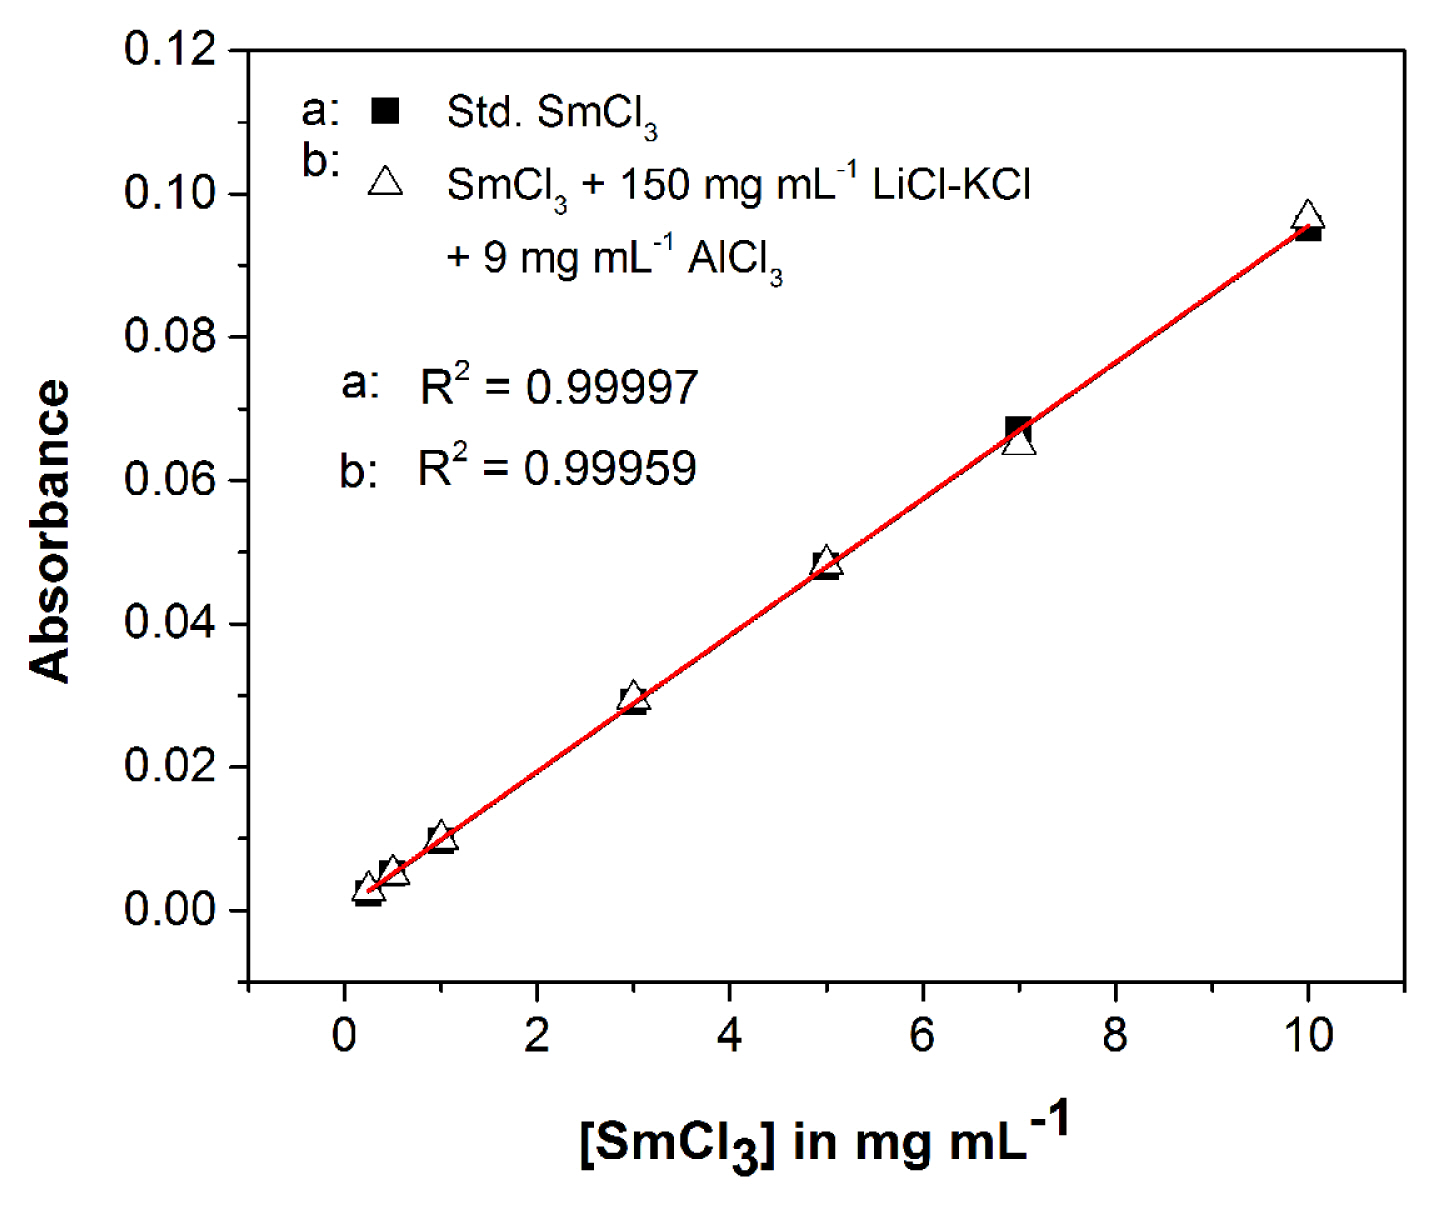
Fig. 10 shows absorption spectrum recorded for F-1 (marked a in the plot, Table 2, E-2-6) over 330–450 nm. For comparison, spectrum is recorded for standard SmCl3 (commercial) solutions and is shown in Fig. 10 (marked b). Several absorption peaks are observed between 330–450 nm correspond to the typical f-f transition of Sm3+ ions. The peaks centered at 345, 363, 375, 391, 402, 417 and 441 nm are attributed to 6H5/2→ 3H7/2, 6H5/2→ 4F9/2, 6H5/2→ 4D5/2, 6H5/2→ 6P7/2, 6H5/2→ 4K11/2, 6H5/2→ 6P5/2 + 4M19/2 and 6H5/2→ 4G9/2 + 4I15/2 transitions [44]. It is seen from the figure that the characteristic absorption peaks of Sm in the filtrate are well matched with that of the standard. This clearly indicates the presence of SmCl3 in the filtrate. The peak absorbance of the strongest absorption peak at 402 nm, which corresponds to 6H5/2→ 4K11/2 transition is used here for quantification of SmCl3. Absorbance spectra are measured by varying concentrations (0.250–10 mg mL−1 ) of standard SmCl3 (commercial) solutions.
Fig. 11 shows a linear calibration plot for standard SmCl3 (commercial) solutions in the range 0.250–10 mg mL−1 used for quantitative analysis (marked a). As the filtrate always contains LiCl-KCl salt as matrix and some amount of unreacted AlCl3, the effect of them is examined by plotting calibration plots in the presence of salt and AlCl3. Fig. 11 (marked b) shows the calibration plot of SmCl3 in presence of 150 mg mL−1 salt and 9 mg mL−1 of AlCl3. These concentrations of salt and AlCl3 are chosen as the concentration of salt and AlCl3 in the filtrate is in the range 120–150 mg mL−1 and 4–9 mg mL−1 (assuming 50% consumption of AlCl3), respectively. The uncertainty in each data point is ≤ 2%. It is seen that the slope of both the plots remains almost same (within ~ 0.3%). This clearly indicates that the absorbance values do not vary for salt up to 150 mg mL−1 and AlCl3 up to 9 mg mL−1. Absorbance values are recorded in the F-1 (Table 1: sample E-1 to E-3, Table 2: sample E-2-1 to E-2-6, Table 3: sample E-2-7 to E-2-S) as well as in the F-2 and from the calibration plot (see Fig. 11, marked b), the concentration of Sm is determined in both the filtrates. The analysis of F-1 shows the amount of SmCl3 which is converted from Sm2O3 after chlorination.
Using the absorbance values in F-1, amount of SmCl3 produced after equilibration in LiCl-KCl is calculated from the calibration plot (Fig 11, marked b). The conversion efficiency is calculated using the equation below
(6)
When stoichiometric amount of AlCl3 are added in the reaction (Table 1, E-1), the conversion efficiency of Sm2O3 is found to be 67.4 (± 0.9) wt.%. Some amount of AlCl3 loss may have occurred due to the sublimation of AlCl3 as white vapours are observed when it is added into the melt at 773 K [46]. To improve the efficiency of the conversion process, the amount of AlCl3 is increased from the stoichiometric amount in the conversion reactions. 85.3 (± 1.5) and 83.6 (± 1.9) wt.% conversion is found when of AlCl3 is double and triple of the stoichiometric amount, respectively. The conversion efficiencies obtained by UV-Vis spectroscopic analyses are compared with ICP-AES analysis (Table 1) and these are found to be in good agreement.
The amount of AlCl3 present in the melt after conversion experiments are analysed by ICP-AES. The analysis shows absence of Al in sample F-1 when stoichiometric amount of AlCl3 is used. This reflects that the stoichiometric amount has been utilized fully and may not be sufficient for full conversion of Sm2O3. When amount of AlCl3 is increased, the analysis shows the presence of ~ 6 wt.% and ~ 20 wt.% of initial AlCl3 in the F-1 for reactions with double and triple of the stoichiometric of AlCl3, respectively. This reflects that in experiment with triple of stoichiometric of AlCl3, the unreacted amount of AlCl3 in the melt only increases, but fails to increase the conversion efficiency. Hence, double the stoichiometric amount of AlCl3 is sufficient for efficient conversion reaction.
To improve the conversion efficiency further, experiments are performed with 50 g of LiCl-KCl with double the stoichiometric amount of AlCl3 and duration of reaction is varied from 0.25 h to 12 h (Table 2, sample E-2-1 to E-2-6). Fig. 12 shows the plot of conversion ratio of Sm2O3 in salt phase (UV-Vis analysis) vs. duration of reaction. It shows that the reaction reaches to 94.8 (± 0.9) wt.% of conversion of Sm2O3 within 15 min (Table 2, E-2-1). Almost same conversion efficiency is observed even after increasing the duration of reaction up to 12 h. It is noted that the values of the conversion efficiencies are close to the values obtained from ICP-AES analysis (Table 2). As the conversion reaction reaches ~ 95 wt.% efficiency within 15 min, it may affect the conversion process of other lanthanides and actinides when Sm2O3 is present in mixture of oxides. Analysis of Sm in sample F-2 shows 3.3 – 5.0 wt.% Sm2O3 present as unreacted in the melt after conversion reactions, which corresponds to 98–99 wt.% of total Sm2O3 used for experiments.
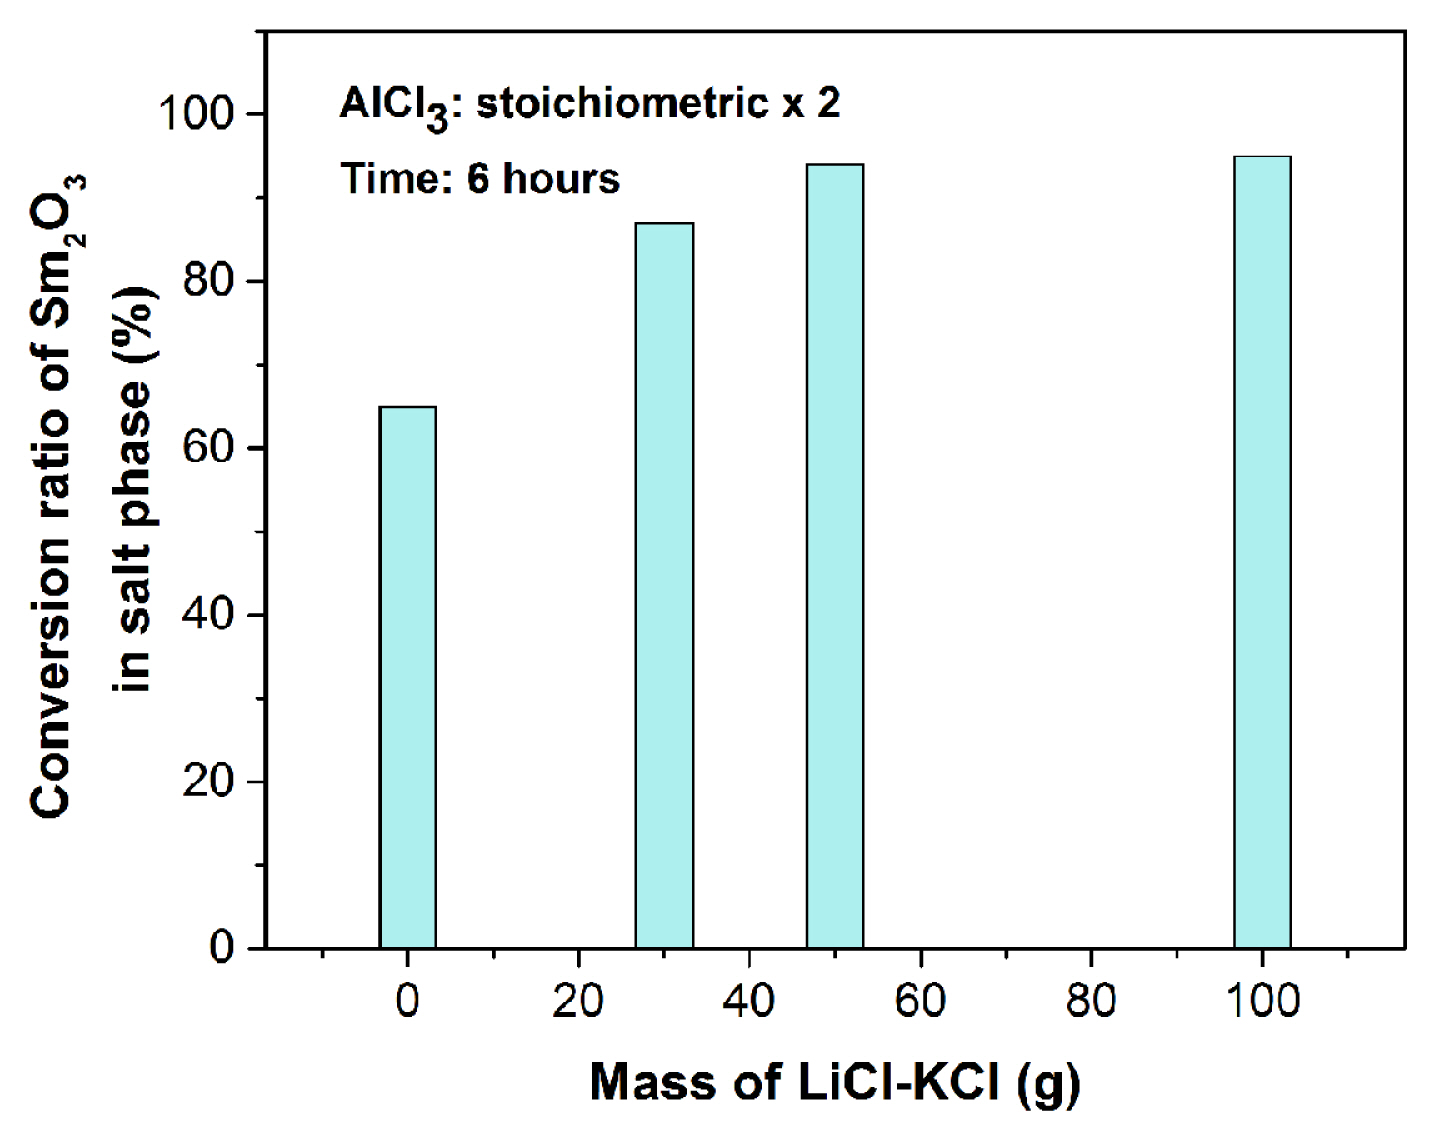
It is observed that the amount of LiCl-KCl salt also has impact on the conversion process. When 30 g of LiCl-KCl salt is used for chlorination reaction (Table 3, sample E-2-7), the oxide particles are found to be floating on the top surface of the molten salt and stirring is difficult in the colloidal mixture. As the reactants do not mix properly in less amount of molten salt, adherence of the reactants has been observed on the side of the crucible leading to decrease in process yield and therefore, maximum ~ 83–85 wt.% conversion of oxide is achieved. To get further improvement in the conversion, the quantity of solvent (salt) is increased and equilibration reactions are conducted using double the stoichiometric amount of AlCl3. Fig. 13 shows the plot of conversion ratio of Sm2O3 in salt phase (UV-Vis analysis) as a function of mass of LiCl-KCl salt. It can be seen that about 95 wt.% conversion is achieved when amount of salt is raised to 50 g. No further improvement is recorded even when salt amount is raised to 100 g. The ICP-AES analysis also reflects the same and the values obtained are provided in the Table 3.
This indicates that 30 g of LiCl-KCl salt is insufficient for proper mixing of the reactants and hence the reaction cannot attain maximum efficiency. Conversion reaction is carried out in absence of LiCl-KCl (Table 3, sample E-2-S). Analysis of the product shows around 64.5 wt.% of samarium oxides has been converted to chlorides. In absence of any medium, AlCl3 vaporised at much higher rate than in dissolved condition in molten LiCl-KCl. As solvent increases the chance of collisions of reactants, conversion efficiency of oxides in LiCl-KCl is higher than the reaction in absence of LiCl-KCl.
4. Conclusions
Conversion of Sm2O3 to SmCl3 in LiCl-KCl was successfully achieved with the aid of AlCl3 at 773 K. The presence of SmCl3 in the reaction product was confirmed by electrochemical methods viz CV and SWV. The cathodic peak at −0.78 V in cyclic voltammetry reflected the presence of Sm3+ in LiCl-KCl melt. The reduction was found to be single electron transfer process from both CV and SWV methods. Diffusion coefficient of Sm3+ ions at 773 K was calculated from cyclic voltammograms and compared with commercial SmCl3 in LiCl-KCl melt. Efficiency of conversion reaction was determined from UV-Vis and ICP-AES methods. About 95 wt.% of conversion was observed in the conversion reaction when amount of AlCl3 was double the stoichiometric amount and 50 g of LiCl-KCl were used. 15 minutes of equilibration time was found to be sufficient to reach the maximum conversion efficiency.